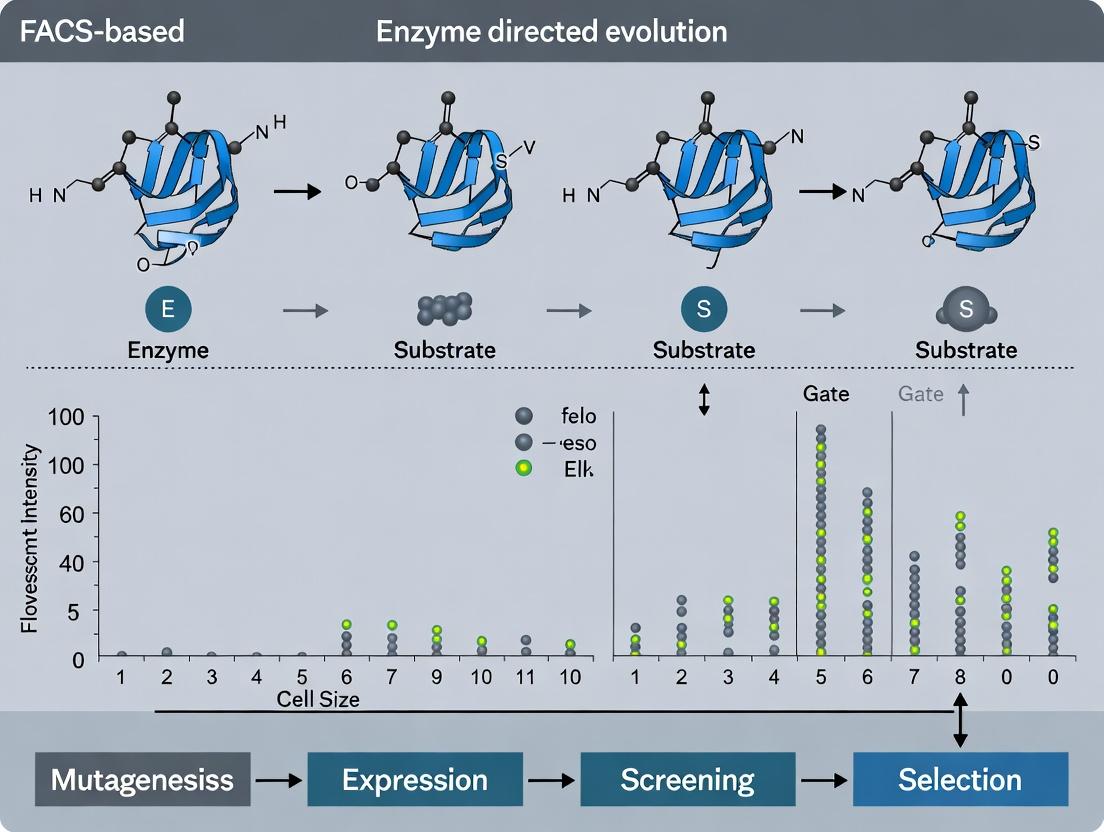
Revolutionizing Enzyme Engineering: A Comprehensive Guide to FACS-Based High-Throughput Screening for Directed Evolution
Directed evolution is a cornerstone of modern protein engineering, yet the throughput and efficiency of screening mutant libraries remain critical bottlenecks.
Revolutionizing Enzyme Engineering: A Comprehensive Guide to FACS-Based High-Throughput Screening for Directed Evolution
Abstract
Directed evolution is a cornerstone of modern protein engineering, yet the throughput and efficiency of screening mutant libraries remain critical bottlenecks. This article provides researchers, scientists, and drug development professionals with an in-depth exploration of Fluorescence-Activated Cell Sorting (FACS) as a transformative solution for enzyme evolution. We begin by establishing the core principles of FACS in the context of genotype-phenotype linkage and its historical role in the field (Foundational & Exploratory). Subsequently, we detail a complete, step-by-step methodological workflow from designing a FACS-compatible reporter system to executing sort cycles and hit validation (Methodological & Application). Recognizing practical challenges, the guide addresses critical troubleshooting, optimization strategies for signal-to-noise ratios, and controlling false positives (Troubleshooting & Optimization). Finally, we validate the approach by benchmarking FACS against alternative screening platforms (e.g., microfluidics, colony screening) and presenting key success metrics and recent, high-impact case studies in therapeutic enzyme and biocatalyst development (Validation & Comparative). This synthesis empowers practitioners to strategically implement FACS, accelerating the development of novel enzymes for biomedical and industrial applications.
The Power of FACS in Directed Evolution: Bridging Genotype and Phenotype at Scale
Directed evolution is a cornerstone of enzyme engineering, yet its throughput is critically constrained by traditional screening methods like microtiter plate assays. This bottleneck limits the explorable sequence space, often resulting in suboptimal variants. This Application Note argues for the integration of Fluorescence-Activated Cell Sorting (FACS) as a high-throughput solution, detailing protocols and data that highlight its superiority in sampling depth, speed, and functionality for identifying rare, high-performance enzyme variants.
The success of directed evolution is contingent on screening library diversity. Traditional methods, such as absorbance-based assays in 96- or 384-well plates, typically screen 10^3 to 10^4 clones. Given that even a modest library for a small protein (e.g., 10^8 variants) surpasses this by orders of magnitude, the probability of discovering elite mutants is low. This creates a "bottleneck" where library potential remains untapped. FACS, capable of analyzing and sorting >10^7 events per hour based on fluorescent signals linked to enzyme activity, bridges this chasm.
Quantitative Comparison of Screening Platforms
The following table summarizes the critical operational parameters of traditional screening versus FACS-based screening.
Table 1: Throughput and Capability Comparison of Screening Methods
| Parameter | Microtiter Plate (UV/Vis) | FACS-Based Screening |
|---|---|---|
| Max Throughput (clones/day) | ~10^4 | >10^8 |
| Assay Time per Clone | Seconds to minutes | Microseconds |
| Minimum Volume | ~50-200 µL | ~1-10 pL (droplet/ cell) |
| Reagent Consumption | High | Very Low |
| Multiplexing Capability | Low (1-2 signals) | High (Multi-parameter) |
| Primary Readout | Bulk, averaged signal | Single-cell resolution |
| Enrichment Factor | 10-100 fold | Up to 10,000-fold per round |
| Key Limitation | Throughput, homogeneity | Signal generation & linkage |
Core FACS Workflow for Enzyme Evolution
The efficacy of FACS hinges on coupling enzyme activity to a fluorescent signal on or within a cell, droplet, or bead.
Diagram: Generalized FACS Screening Workflow
Title: FACS Screening Workflow for Enzyme Evolution
Key Signaling Pathways for Activity Detection
Fluorescence generation often relies on engineered substrate conversion.
Diagram Title: Fluorescence-Activated Substrate Turnover Pathways
Detailed Protocol: FACS-Based Screening for Esterase Activity
This protocol details a cell-surface display approach for esterase evolution in Saccharomyces cerevisiae.
Reagent & Material Toolkit
Table 2: Essential Research Reagent Solutions
| Item | Function/Benefit |
|---|---|
| Yeast Surface Display Vector (e.g., pYD1) | Tethers enzyme variant to cell wall via Aga2p fusion for substrate access. |
| Fluorogenic Ester Substrate (e.g., Fluorescein diacetate) | Cell-permeant; hydrolysis by active esterase yields fluorescent, retained fluorescein. |
| FACS Buffer (PBS + 0.5% BSA) | Maintains cell viability, reduces non-specific binding during sort. |
| Propagation Media (SD-CAA) | Selective growth for plasmid maintenance. |
| Induction Media (SG-CAA) | Galactose-induced expression of enzyme-display fusion. |
| Reference Beads (e.g., Spherotech) | Critical for daily instrument calibration (alignment, drop delay). |
| High-Efficiency Electrocompetent Yeast Cells | Essential for generating large, representative libraries (>10^7 diversity). |
Step-by-Step Protocol
Day 1: Library Transformation & Expansion
- Perform high-efficiency lithium acetate transformation of the mutagenized esterase library into S. cerevisiae EBY100 strain.
- Plate on SD-CAA agar plates and incubate at 30°C for 48-72h. Harvest all colonies to ensure library representation. Calculate library size (CFU). Aim for >10^7 unique clones.
Day 3: Induction of Enzyme Display
- Inoculate harvested library into 50 mL SD-CAA to an OD600 ~0.5. Grow at 30°C, 250 rpm to OD600 2.0-4.0.
- Centrifuge (3000 x g, 5 min), wash cells with sterile water, and resuspend in 25 mL SG-CAA to OD600 1.0.
- Induce at 20°C, 250 rpm for 20-24h. Lower temperature enhances proper folding.
Day 4: Labeling & FACS Sort
- Labeling: Harvest 10^8 induced cells (by centrifugation). Wash 2x with ice-cold PBSA (PBS + 0.5% BSA). Resuspend in 1 mL PBSA containing 100 µM Fluorescein diacetate (from 100 mM DMSO stock). Incubate in dark, on ice, for 30 min. Quench with 10 mL ice-cold PBSA and centrifuge.
- FACS Setup: Resuspend cells in 5 mL PBSA, filter through 35 µm mesh. Calibrate sorter (e.g., BD FACSAria III) using calibration beads. Set nozzle to 100 µm for yeast.
- Gating & Sorting: Define sort gate using negative (no substrate) and positive (wild-type enzyme) controls. Gate on forward/side scatter for single cells, then on high fluorescein fluorescence (FITC channel, 530/30 nm). Use "Purity" sort mode into a tube containing 500 µL SD-CAA media.
- Recovery: Plate sorted cells immediately on SD-CAA plates and incubate at 30°C for 48h. This constitutes Round 1 output.
Day 6+: Iteration & Validation
- Repeat induction and sorting process for 2-3 rounds, progressively tightening the fluorescence gate.
- After the final sort, plate for single colonies. Pick 96 clones for validation in microtiter plate-based kinetic assays to quantify improvements in kcat/Km.
Traditional screening methods impose a severe bottleneck in directed evolution, statistically confining researchers to a minuscule fraction of sequence space. FACS-based screening, with its unmatched throughput and single-cell resolution, is a transformative solution. Successful implementation requires careful coupling of activity to fluorescence and meticulous sorting protocol execution. Integrating FACS into the directed evolution pipeline is essential for unlocking the full potential of enzyme libraries in industrial biocatalysis and therapeutic development.
Application Note: FACS in Enzyme Directed Evolution
Fluorescence-Activated Cell Sorting (FACS) has become an indispensable tool in modern enzyme directed evolution campaigns, enabling the screening of combinatorial libraries exceeding 10^10 variants. This application note details how core FACS principles facilitate ultra-high-throughput, quantitative, single-cell analysis and isolation, directly accelerating the discovery of novel biocatalysts for therapeutic and industrial applications.
Core Technical Principles and Quantitative Advantages
FACS integrates fluidics, optics, and electronics to interrogate and sort individual cells based on user-defined fluorescent parameters. Its application in enzyme evolution capitalizes on several key advantages:
- Throughput: Modern sorters can analyze >100,000 events per second and physically sort populations at rates of 20,000-70,000 cells per second.
- Multiplexing: Simultaneous measurement of multiple fluorescence signals (typically 2-18 parameters) allows for complex, multi-dimensional phenotypic screening.
- Sensitivity: Detection of fewer than 100 fluorescent molecules per cell is possible.
- Viability: Maintains sterility and high cell viability (>95% for most prokaryotes and eukaryotes) post-sort, enabling direct regrowth and iterative evolution.
Table 1: Quantitative Comparison of FACS Performance for Library Screening
| Parameter | Typical FACS Capability | Relevance to Enzyme Evolution |
|---|---|---|
| Analysis Rate | 10^5 - 10^6 cells/sec | Enables full-library screening in minutes to hours. |
| Sorting Rate | 10^3 - 10^4 cells/sec (pure sort mode) | Rapid isolation of top-performing variants. |
| Sort Purity | >98% (with proper gating) | Ensures enriched populations are not contaminated. |
| Cell Viability | 80-99% (depends on organism & pressure) | Critical for downstream cultivation of sorted clones. |
| Multiparameter Detection | 2-18 fluorescent colors | Enables ratiometric assays, substrate co-localization, and coupling enzyme activity to reporter signals (e.g., GFP). |
Key Protocols for Enzyme Evolution Campaigns
Protocol 1: Cell Surface Display Coupled with Fluorescent Substrate Binding
This protocol is for sorting enzyme variants displayed on yeast or bacterial surfaces based on ligand binding affinity.
I. Materials & Repertoire Preparation
- Library Strain: S. cerevisiae EBY100 expressing enzyme library fused to Aga2p (yeast display) or E. coli expressing enzyme fused to an outer membrane protein.
- Labeling Reagent: Biotinylated target substrate or inhibitor.
- Detection Reagents: Streptavidin conjugated to a fluorophore (e.g., SA-PE, #EA4335 emission), and a primary antibody against an epitope tag (e.g., anti-c-Myc) followed by a secondary antibody with a different fluorophore (e.g., Alexa Fluor 488, #34A853 emission) for normalization.
- Buffers: PBSB (PBS + 1 mg/mL BSA), wash buffer (PBS).
II. Staining & FACS Procedure
- Induction: Induce library expression per host system protocol (e.g., SG-CAA media for yeast).
- Labeling: Harvest ~10^8 cells, wash, and incubate with biotinylated substrate (e.g., 100 nM - 1 µM) in PBSB on ice for 60 min.
- Wash: Wash cells 3x with cold wash buffer to remove unbound substrate.
- Detection: Incubate cells with SA-fluorophore and anti-tag antibodies in PBSB on ice for 30 min in the dark.
- Wash & Resuspend: Wash 2x and resuspend in ice-cold PBS + optional propidium iodide (PI, #FBBC05 emission) for viability gating. Pass through a 35-µm cell strainer.
- FACS Analysis & Gating:
- Create a scatter gate (FSC-A vs. SSC-A) to exclude debris.
- Apply a single-cell gate (FSC-H vs. FSC-A) to exclude doublets.
- Gate on PI-negative (viable) cells.
- Apply a normalization gate for uniform display (e.g., high AF488 signal from anti-tag staining).
- Sort Gate: Define the top 0.1-1% of cells with the highest ratio of substrate-binding signal (PE) to display signal (AF488). This selects for variants with highest binding affinity.
- Sort & Recovery: Sort cells directly into rich media. Plate for single colonies and/or expand liquid culture for DNA recovery and subsequent rounds of evolution.
Protocol 2: Intracellular Enzyme Activity via Fluorogenic Product Accumulation
This protocol sorts cells based on the intracellular conversion of a non-fluorescent substrate into a fluorescent product.
I. Materials & Repertoire Preparation
- Library Strain: E. coli or yeast expressing intracellular enzyme library.
- Fluorogenic Substrate: A membrane-permeant, non-fluorescent substrate that yields a fluorescent, membrane-impermeant product upon enzymatic reaction (e.g., fluorescein diacetate (FDA) for esterases, or custom-designed substrates).
- Buffers: Appropriate growth media, PBS or assay buffer.
II. Assay & FACS Procedure
- Expression: Grow and induce enzyme expression in the host.
- Loading: Incubate cells with the fluorogenic substrate (optimized concentration, typically 10-100 µM) in assay buffer or media at the desired reaction temperature (e.g., 30°C) for a defined time (e.g., 20-60 min).
- Quenching & Wash: Place cells on ice. Wash once with ice-cold buffer to stop the reaction and remove external substrate/product.
- FACS Analysis & Gating:
- Gate on single, viable cells as in Protocol 1.
- Sort Gate: Define the top population based on the fluorescence intensity of the product channel (e.g., FITC, #34A853). The brightest cells contain the most active enzyme variants.
- Sort & Recovery: Sort cells as above. For optimal results, include a control strain with wild-type or no enzyme activity to set the baseline gate.
The Scientist's Toolkit: Essential Reagents for FACS-Based Enzyme Evolution
Table 2: Key Research Reagent Solutions
| Item | Function in FACS-Based Evolution | Example/Note |
|---|---|---|
| Fluorogenic Substrate | Provides the readout for enzymatic activity; must be cell-permeant and yield a trapped fluorescent product. | Fluorescein Diacetate (FDA), resorufin esters, coumarin derivatives. |
| Biotinylated Ligand | Enables affinity-based sorting for binding enzymes (kinases, proteases, etc.). | Biotinylated ATP, peptide substrates, or small-molecule inhibitors. |
| Streptavidin-fluorophore Conjugate | High-affinity detection of biotinylated ligands bound to displayed enzymes. | SA-PE, SA-APC; chosen for brightness and spectral overlap. |
| Epitope Tag Antibodies | Normalizes for surface expression levels in display systems, ensuring selection for activity per enzyme, not just expression. | Anti-c-Myc, Anti-HA, Anti-FLAG conjugated to a spectrally distinct fluorophore. |
| Viability Stain | Allows exclusion of dead cells, which can have aberrant fluorescence and non-specific binding. | Propidium Iodide (PI), DAPI, or SYTOX dyes. |
| Sort Collection Media | Maintains cell viability during and after the sort. | Rich media (e.g., 2xYT for E. coli, SOC recovery media) with optional antibiotics. |
Visualizing Workflows and Assay Principles
Title: FACS Workflow for Enzyme Evolution Screening
Title: Intracellular Fluorogenic Activity Assay Principle
Within the broader thesis on FACS-based sorting for enzyme directed evolution, establishing a robust physical linkage between a gene (genotype) and the molecule it encodes (phenotype) is paramount. Display technologies enable this by presenting the functional protein on the surface of a host cell, allowing Fluorescence-Activated Cell Sorting (FACS) to isolate variants with desired properties based on a fluorescent signal. This application note details the three primary display platforms compatible with high-throughput FACS screening.
Table 1: Key Characteristics of FACS-Compatible Display Systems
| Feature | Yeast Surface Display (YSD) | Bacterial Surface Display (BSD) | Mammalian Cell Surface Display (MCSD) |
|---|---|---|---|
| Typical Host | Saccharomyces cerevisiae | E. coli | HEK293, CHO |
| Display Protein | Aga1p-Aga2p fusion | Autotransporter, Ice Nucleation Protein | Transmembrane protein (e.g., PDGFR) |
| Library Capacity | 10^7 – 10^9 | 10^8 – 10^10 | 10^6 – 10^7 |
| FACS Cycle Time | 24-48 hours | 6-12 hours | 48-72 hours |
| Key Advantages | Eukaryotic PTMs, robust secretion, medium throughput. | Largest library sizes, rapid growth, simple genetics. | Native human PTMs, complex receptor assembly, proper folding. |
| Primary Limitations | Lower library capacity than bacterial. | Lack of eukaryotic PTMs, potential for misfolding. | Lowest library capacity, slow growth, highest cost. |
| Typical Sorting Efficiency | >95% viability, ~10^6 cells/sort. | >90% viability, ~10^7 cells/sort. | >85% viability, ~10^6 cells/sort. |
| Common Applications | Antibody/Protein affinity maturation, protein engineering. | Peptide/ScFv discovery, enzyme evolution for soluble substrates. | Membrane protein engineering (GPCRs, ion channels), full-length antibody display. |
Experimental Protocols
Protocol for Yeast Surface Display FACS Sorting
Purpose: Isolate yeast clones displaying a protein variant with enhanced binding affinity from a mutant library.
Materials: Induced yeast display library, anti-c-Myc antibody (primary, mouse), fluorescent antigen (or biotinylated antigen + streptavidin-fluorophore), anti-HA antibody (primary, chicken), Alexa Fluor 488-conjugated anti-mouse IgG, Alexa Fluor 647-conjugated anti-chicken IgG, FACS buffer (PBS + 1% BSA), FACS sorter.
Procedure:
- Induction: Grow yeast library in SG-CAA media at 20-30°C for 20-48 hours to induce protein expression.
- Labeling: Pellet 10^7 cells, wash with FACS buffer.
- Co-incubate with primary antibodies (anti-c-Myc, anti-HA) and the fluorescently labeled target antigen (or with biotinylated antigen) in 100 µL FACS buffer for 60 min on ice.
- Wash cells twice with cold FACS buffer.
- If using biotinylated antigen, incubate with streptavidin-fluorophore conjugate for 30 min on ice. Wash.
- If using indirect antibody detection, incubate with fluorophore-conjugated secondary antibodies for 30 min on ice. Wash.
- Analysis & Sorting: Resuspend in cold FACS buffer containing propidium iodide (viability dye). Analyze on a FACS sorter. Gate for live (PI-negative), properly displayed (HA-positive) cells. Sort the top 0.1-5% of cells showing the highest antigen binding (AF647:AF488 ratio) into recovery media.
- Recovery & Expansion: Sort directly into SD-CAA media, incubate at 30°C for 48 hours, then plate on selective agar to generate colonies for sequencing and validation.
Protocol for Bacterial Surface Display FACS Sorting
Purpose: Enrich E. coli cells expressing a displayed enzyme with improved catalytic activity using a fluorescent product.
*Materials: E. coli display library (e.g., using Lpp-OmpA or INP system), induced culture, fluorescent substrate (or substrate + coupled detection system), FACS buffer (PBS + 0.1% BSA), propidium iodide, FACS sorter.
Procedure:
- Induction: Grow library to mid-log phase, add inducer (e.g., IPTG, arabinose) for 2-4 hours at 30°C.
- Labeling via Activity: Harvest 10^8 cells, wash gently.
- Incubate cells with a membrane-permeable, non-fluorescent substrate (pro-fluorophore) or a directly actuated fluorogenic substrate specific to the enzyme's activity. Reaction is performed in appropriate buffer for 15-60 min at RT or 37°C.
- Quench reaction on ice and wash twice with cold FACS buffer.
- Analysis & Sorting: Resuspend in cold FACS buffer with propidium iodide. Gate for live (PI-negative), high-fluorescence cells representing high enzymatic activity. Sort the top 1-10% of fluorescent population into LB media.
- Recovery: Allow sorted cells to recover in LB for 1-2 hours at 37°C before plating or re-induction for the next sorting round.
Protocol for Mammalian Cell Surface Display FACS Sorting
Purpose: Isolate mammalian cells displaying a correctly folded and assembled multisubunit membrane receptor.
*Materials: Lentiviral-transduced mammalian cell library, growth media, live-cell labeling antibody or ligand (fluorophore-conjugated), FACS buffer (PBS + 2% FBS + 1 mM EDTA), DAPI, FACS sorter with large nozzle (≥100 µm).
Procedure:
- Library Generation: Transduce target mammalian cells (HEK293T) with a lentiviral library encoding the membrane protein variant. Culture under selection for 5-7 days.
- Labeling: Harvest cells using gentle dissociation buffer (e.g., PBS/EDTA). Wash with FACS buffer.
- Incubate with fluorophore-conjugated antibody or high-affinity ligand that binds specifically to the correctly folded extracellular domain of the target receptor. Perform on ice for 30-60 min.
- Wash cells twice with cold FACS buffer.
- Analysis & Sorting: Resuspend in cold FACS buffer containing DAPI. Gate for single, live (DAPI-negative) cells. Sort the top 0.5-5% of highest fluorescent cells directly into pre-warmed complete growth media in a tissue culture plate.
- Recovery & Expansion: Allow sorted cells to adhere and expand for 3-5 days before passaging or subsequent analysis/round of sorting.
Visualization of Workflows & Pathways
Diagram Title: Yeast Surface Display FACS Sorting Workflow
Diagram Title: Decision Logic for Selecting a Display Platform
The Scientist's Toolkit
Table 2: Essential Research Reagent Solutions for FACS-Based Display Sorting
| Item | Function & Application | Example/Note |
|---|---|---|
| Fluorogenic Substrate/Probe | Generates a fluorescent signal upon enzymatic conversion or binding. Core to phenotype detection. | Fluorescein-di-β-D-galactopyranoside (FDG) for β-galactosidase; non-membrane-permeable substrates for surface enzyme activity. |
| Biotinylated Target/Antigen | Enables flexible detection via high-affinity streptavidin-fluorophore conjugates. Universal labeling strategy. | Used in YSD and MCSD for affinity sorting. Allows signal amplification. |
| Viability Dye (PI/DAPI) | Distinguishes live from dead cells during FACS, ensuring sorted population health. | Propidium iodide (PI) for YSD/BSD; DAPI for MCSD (fixable). |
| Surface Expression Marker Tag | Antibody against an epitope tag (HA, c-Myc, FLAG) confirms proper display, enabling normalization. | Critical for gating in YSD (e.g., anti-HA-AF488). |
| Mild Dissociation Agent | Detaches adherent mammalian cells gently without damaging surface proteins. | PBS with 1-10 mM EDTA. Avoid trypsin for sensitive epitopes. |
| FACS Recovery Media | Nutrient-rich, antibiotic-free media to support immediate cell growth post-sort. | SD-CAA for yeast; LB for bacteria; complete FBS-containing media for mammalian cells. |
| Library Cloning Reagent | High-efficiency transformation method to generate large, diverse display libraries. | Electrocompetent cells for E. coli; LiAc transformation for yeast; Lentivirus for mammalian cells. |
This document details the design and application of fluorescent reporters for monitoring enzyme activity, framed within the context of a Flow Cytometry-Activated Cell Sorting (FACS)-based directed evolution pipeline. The directed evolution of enzymes requires high-throughput screening methods to identify rare variants with enhanced activity, specificity, or stability. Fluorescent reporters provide a sensitive, quantitative, and FACS-compatible readout of intracellular enzyme function, enabling the isolation of improved clones from vast mutant libraries. This guide covers three principal reporter strategies: Förster Resonance Energy Transfer (FRET), substrate conversion to a fluorescent product, and transcriptional activation of a fluorescent protein.
Core Reporter Mechanisms & Quantitative Comparison
FRET-Based Reporters
FRET reporters consist of a donor fluorophore and an acceptor fluorophore linked by an enzyme-specific cleavable peptide sequence. Upon excitation of the donor, energy is transferred to the acceptor if they are in close proximity, resulting in acceptor emission. Enzyme cleavage of the linker separates the fluorophores, abolishing FRET and increasing donor emission. This ratiometric measurement (donor/acceptor emission) is internally controlled, reducing noise from expression variability.
Substrate Conversion Reporters
These reporters utilize a non-fluorescent substrate (or a substrate with distinct spectral properties) that is converted by the target enzyme into a fluorescent product that accumulates intracellularly. The fluorescent signal intensity is proportional to enzyme activity. These are often simpler to design but can be less specific due to potential background hydrolysis.
Transcriptional Activation Reporters
In this circuit, the enzyme's activity is coupled to the expression of a fluorescent protein. A common design uses a transcription factor that is activated or released from inhibition upon enzyme-mediated modification. This activated factor then drives the expression of a fluorescent protein gene (e.g., GFP). This strategy provides signal amplification but has slower kinetics due to the time required for transcription and translation.
Table 1: Quantitative Comparison of Fluorescent Reporter Strategies
| Parameter | FRET-Based | Substrate Conversion | Transcriptional Activation |
|---|---|---|---|
| Signal Kinetics | Fast (seconds-minutes) | Fast (minutes) | Slow (hours) |
| Signal Amplification | No | Moderate (product accumulation) | High (transcriptional/translational) |
| Cellular Context | Live-cell, subcellular localization | Live-cell, cytoplasmic | Live-cell, whole-cell |
| FACS Compatibility | Excellent (ratiometric reduces noise) | Good (requires careful gating) | Excellent (stable signal) |
| Background Signal | Low (ratiometric) | Medium (autofluorescence, hydrolysis) | Low (minimal leaky expression) |
| Typical Dynamic Range | 5- to 20-fold | 10- to 100-fold | 100- to 1000-fold |
| Primary Readout | Donor/Acceptor Emission Ratio | Fluorescence Intensity | Fluorescence Intensity |
| Best For | Proteases, kinases (with IP) | Esterases, phosphatases, β-lactamases | Metabolic pathways, ligand biosynthesis |
Detailed Experimental Protocols
Protocol 1: Implementing a FRET Reporter for Protease Evolution
Objective: To screen a library of protease variants using a FRET-based reporter for enhanced cleavage activity via FACS.
Materials:
- FRET Plasmid: pFRET-ProteaseSubstrate encoding CFP-YFP linked by target sequence.
- Mutant Library: Plasmid library of protease variants (e.g., in pBAD or equivalent).
- Host Cells: E. coli BL21(DE3) or relevant eukaryotic cell line.
- FACS Buffer: PBS pH 7.4, 2 mM EDTA, 0.1% glucose (for bacteria).
Procedure:
- Co-transformation: Co-transform the FRET reporter plasmid and the protease mutant library plasmid into the host cells. Select on appropriate dual antibiotics.
- Induction & Expression: Grow cultures to mid-log phase. Induce protease expression (e.g., with 0.2% arabinose for pBAD). Induce or allow constitutive expression of the FRET reporter as required.
- Preparation for FACS: Harvest cells 2-3 hours post-induction. Wash cells twice in ice-cold FACS Buffer. Resuspend at ~10⁷ cells/mL in FACS Buffer. Keep on ice and protected from light.
- FACS Gating & Sorting:
- Analyze cells using a flow cytometer equipped with 405 nm (for CFP) and 514 nm (for YFP) lasers.
- Gate on healthy, single cells based on forward and side scatter.
- Create a dot plot of CFP emission (e.g., 475/40 nm) vs. YFP emission (e.g., 535/30 nm).
- Define a sorting gate for cells with a high CFP/YFP emission ratio (indicating successful cleavage). Include the top 0.1-1% of the population.
- Sort cells from this gate into recovery media.
- Recovery & Validation: Allow sorted cells to recover overnight. Plate for single colonies. Re-test clones for FRET signal to confirm phenotype. Isolate plasmid DNA for sequencing.
Protocol 2: Substrate Conversion Reporter for β-Lactamase Evolution
Objective: To sort β-lactamase variants with improved activity using the membrane-permeable fluorogenic substrate CCF2/AM (LiveBLAzer technology).
Materials:
- Substrate: CCF2/AM (Thermo Fisher). CCF2 is a FRET substrate (coumarin -> fluorescein) cleaved by β-lactamase.
- Cells: E. coli expressing β-lactamase variant library.
- Loading Buffer: 1X Loading Solution with 1 mM probenecid in PBS.
- FACS Buffer: As above.
Procedure:
- Substrate Loading: Harvest cells expressing the β-lactamase library. Pellet and resuspend in Loading Buffer at ~10⁷ cells/mL.
- Incubation: Add CCF2/AM substrate to a final concentration of 1 µM. Incubate in the dark at room temperature for 60-90 minutes.
- Signal Development: The intact substrate emits green fluorescence (520 nm) upon 409 nm excitation. Cleavage by β-lactamase disrupts FRET, resulting in blue coumarin emission (447 nm).
- FACS Sorting: Analyze cells using a 409 nm laser. Gate on single cells. Create a histogram of blue emission (447/60 nm). Sort the population with the highest blue fluorescence intensity (top 0.5-2%). The shift from green to blue is absolute and highly specific.
- Recovery & Analysis: Sort cells into rich media, recover, and characterize.
Protocol 3: Transcriptional Reporter for P450 Monooxygenase Evolution
Objective: To isolate P450 variants with enhanced activity using a transcriptionally coupled GFP reporter responding to product formation.
Materials:
- Reporter Strain: Engineered E. coli or yeast harboring:
- a) P450 mutant library.
- b) A biosensor transcription factor (TF) activated by the P450 product.
- c) A GFP gene under the control of the TF-responsive promoter.
- Induction Media: Media containing the target substrate for the P450 enzyme.
- FACS Buffer.
Procedure:
- Library Induction: Inoculate the reporter strain library in deep-well plates with media containing the target substrate. Induce P450 expression. Incubate for 12-24 hours to allow for enzymatic conversion, TF activation, and GFP expression/ maturation.
- Cell Harvest: Pellet cells and wash twice with FACS Buffer.
- FACS Sorting: Analyze cells using a 488 nm laser and standard GFP filter set (e.g., 530/30 nm). Gate for single cells. Sort the population exhibiting the highest GFP fluorescence (top 0.5-5%). This population encodes P450 variants that produced the most activating product.
- Enrichment: Perform 2-3 rounds of sorting to enrich active clones before plating for single-colony analysis.
The Scientist's Toolkit: Research Reagent Solutions
Table 2: Essential Materials for Fluorescent Reporter Assays
| Item (Example Product) | Function / Application |
|---|---|
| FRET Plasmid Vectors (e.g., pSCA) | Backbone for cloning cleavable peptide sequences between CFP/YFP or other FRET pairs. |
| Fluorogenic Substrates (e.g., CCF2/AM) | Cell-permeable, enzyme-specific substrates that become fluorescent upon cleavage. |
| LiveBLAzer FRET Substrates | Optimized β-lactamase substrates for robust live-cell screening. |
| Flow Cytometry Calibration Beads | Essential for daily instrument calibration, ensuring sort accuracy and reproducibility. |
| Probenecid | Anion transport inhibitor; used in substrate loading buffers to prevent dye efflux. |
| Library Efficiency DH10B Cells | High-efficiency electrocompetent E. coli for optimal transformation of mutant libraries. |
| FACS Tubes (5mL Polystyrene) | Specialized tubes with low cell adhesion and compatibility with sorter fluidics. |
| Recovery Media (e.g., SOC + 1% Glucose) | Rich media to maximize viability of fragile, sorted single cells. |
Visualization: Reporter Mechanisms & Workflows
Diagram 1: FRET Reporter Cleavage Mechanism
Diagram 2: Generic FACS-Based Directed Evolution Workflow
Diagram 3: Substrate Conversion Reporter Principle
Within the paradigm of FACS-based sorting for enzyme directed evolution, the integration of Fluorescence-Activated Cell Sorting (FACS) has been transformative. This application note charts the key historical milestones where FACS was adapted to overcome critical bottlenecks in enzyme engineering, shifting the field from low-throughput plate-based screens to ultra-high-throughput, quantitative sorting of cell libraries.
Key Milestones and Quantitative Data
Table 1: Historical Milestones in FACS for Enzyme Engineering
| Year | Milestone Achievement | Key Innovation | Throughput Gain (vs. traditional) | Enzyme Class Demonstrated |
|---|---|---|---|---|
| ~1997-1999 | First linkage of enzyme activity to fluorescence in droplets. | Use of fluorogenic substrates (e.g., FG- or MUG-based) coupled with intracellular expression. | ~10² - 10³ fold | Glycosidases, Esterases |
| 2003-2005 | Direct in vivo screening via surface display and substrate capture. | Yeast surface display of enzymes with labeling by fluorescent product analogs or inhibitors. | ~10⁷ cells/hr | Proteases, Lipases |
| 2004-2006 | Co-optor assay for bond-forming enzymes. | Fluorescent product is captured on the enzyme-expressing cell via a co-opted binding interaction. | ~10⁷ cells/hr | DNA polymerases, Ligases |
| 2006-2011 | Development of genetically encoded biosensor substrates. | Intracellular FRET-based reporters for protease activity enable completely intracellular sorting. | ~10⁸ cells/hr | Caspases, TEV protease |
| 2011-2015 | Microfluidic droplet sorting (FADS) for enzymes. | Compartmentalization in picoliter droplets prevents cross-talk, enabling direct assays with fluorescent products. | ~10⁷ droplets/hr | Aldolases, Phosphatases |
| 2018-Present | Ultra-high-throughput kinetic profiling (K-Sort). | Multi-parameter sorting based on real-time fluorescence development to extract kinetic constants kcat/K*M. | ~10⁷ cells/hr | Diverse (e.g., P450s, PETases) |
Detailed Protocols
Protocol 1: Yeast Surface Display-Based Sorting for Esterase Evolution
Objective: Isolate variants with enhanced activity from a displayed library. Materials: pYD1 display vector, S. cerevisiae EBY100, Fluorogenic ester substrate (e.g., fluorescein diacetate), FACS buffer (PBS + 1 mg/mL BSA), FACSAria or equivalent sorter.
- Library Construction: Clone mutagenized esterase gene into pYD1, fuse to Aga2p. Transform EBY100.
- Induction: Grow cells in SG-CAA medium at 20°C for 24-48 hrs to induce expression.
- Labeling: Wash 10⁸ cells with FACS buffer. Incubate with 50 µM fluorescein diacetate for 15-30 min at RT, quench on ice.
- FACS Sorting: Gate on cells displaying protein (via anti-c-Myc epitope tag, 647nm). Sort the top 0.1-1% brightest cells in the FITC channel (product fluorescence).
- Recovery & Re-sorting: Grow sorted cells, repeat process for 3-5 rounds with increasing stringency (shorter reaction time).
Protocol 2: Intracellular FRET-Based Protease Sorting
Objective: Evolve protease substrate specificity using a genetically encoded sensor. Materials: FRET plasmid (e.g., ECFP-substrate-EYFP), E. coli or yeast expression host, Flow cytometer.
- Sensor Library: Clone protease library into vector co-expressing the FRET sensor with the target cleavage sequence.
- Expression: Induce protease and sensor expression in host cells.
- Equilibration: Allow 2-4 hours for potential intracellular protease cleavage.
- FACS Analysis & Sorting: Excite at 405 nm. Measure emission at 475 nm (donor, ECFP) and 527 nm (acceptor, EYFP). Sort cells with the highest donor/acceptor emission ratio (indicating cleavage).
- Iteration: Plate sorted cells, isolate plasmids, and subject to further rounds of diversification and sorting.
Visualizations
Title: General Workflow for FACS-Based Enzyme Directed Evolution
Title: Surface Display and Fluorogenic Substrate Assay Principle
The Scientist's Toolkit: Essential Research Reagents & Materials
Table 2: Key Reagents for FACS-Based Enzyme Engineering
| Item | Function/Application |
|---|---|
| Fluorogenic Substrates (e.g., MUG, FDG, AMC derivatives) | Enzyme cleavage releases a fluorescent molecule, enabling direct activity measurement. |
| Yeast Surface Display System (pYD1, EBY100 strain) | Anchors enzyme extracellularly for access to bulky substrates and facile labeling. |
| Mammalian Display Systems (pDisplay, etc.) | For enzymes requiring mammalian post-translational modifications (e.g., kinases). |
| Fluorescently Labeled Inhibitors or Product Analogs | Bind active enzyme on cell surface for sorting based on binding affinity/kinetics. |
| Genetically Encoded FRET Biosensors (CFP-YFP pairs) | Enable completely intracellular sorting for proteases, reporters of metabolic state. |
| Microfluidic Droplet Generators & Sorters | Compartmentalize single cells with substrates for assays requiring product capture. |
| Anti-epitope Tags Antibodies (c-Myc, HA, FLAG), Fluorescently Conjugated | Confirm surface expression levels for gating and normalization (ratiometric sorting). |
| FACS-Compatible Buffer (PBS + 0.5-1% BSA or SCB) | Maintains cell viability, reduces non-specific binding and clogging during sort. |
| High-Efficiency Electrocompetent Cells (e.g., MC1061, TG1 for E. coli) | Essential for efficient library transformation and maintenance of diversity. |
A Step-by-Step Protocol: Implementing FACS for Your Enzyme Evolution Campaign
In FACS-based directed enzyme evolution, the initial design and cloning phase is critical. This phase involves constructing a genetically-encoded mutant library and a reporter plasmid that converts enzymatic activity into a quantifiable fluorescent signal sortable by Fluorescence-Activated Cell Sorting (FACS). This protocol is designed for the evolution of a hydrolytic enzyme (e.g., a phosphatase or protease), where product formation is linked to transcriptional activation of a fluorescent protein.
Key Research Reagent Solutions
| Reagent/Material | Function in Protocol | Key Considerations |
|---|---|---|
| High-Fidelity DNA Polymerase (e.g., Q5) | Amplifies gene fragments for library construction with minimal error rates. | Essential for maintaining library diversity and avoiding bias from polymerase errors. |
| Golden Gate Assembly Mix | Enables seamless, scarless assembly of multiple DNA fragments (e.g., library variant into vector backbone). | Preferred over traditional restriction/ligation for its efficiency in constructing complex plasmids. |
| Chemically Competent E. coli (e.g., NEB 10-beta) | Host for plasmid transformation and library amplification. | High transformation efficiency (>1e9 cfu/µg) is crucial for achieving full library coverage. |
| Fluorescent Protein Gene (e.g., sfGFP, mCherry) | Encodes the reporter signal for FACS detection. | sfGFP is recommended for fast maturation and brightness; mCherry serves as a good secondary marker. |
| Inducible Promoter (e.g., PBAD, T7) | Controls expression of the enzyme variant library. | Tight repression and tunable induction are required to control selection pressure. |
| Two-Hybrid Transcriptional Activator System | Core of the reporter plasmid; enzyme product binds/activates a transcription factor. | Common systems: bacterial (e.g., Phosphate: PhoB/PhoR) or yeast-based adapted for mammalian cells. |
| Flow Cytometry Reference Beads | Used for daily calibration of the FACS instrument. | Ensures sort efficiency and reproducibility over multiple experimental days. |
| Plasmid Miniprep & Gel Extraction Kits | For purification of intermediate DNA constructs. | Quality of DNA directly impacts subsequent assembly efficiency. |
Protocol: Construction of a FACS-Optimized Reporter Plasmid
Principle
The reporter plasmid is designed so that the enzymatic reaction product (e.g., inorganic phosphate from phosphatase activity) triggers a two-component signaling cascade. This leads to the transcriptional activation of a gene encoding a fluorescent protein (e.g., GFP). Cells harboring more active enzyme variants produce more product, leading to brighter fluorescence, enabling isolation by FACS.
Detailed Methodology
A. Design of Reporter Plasmid Components
- Transcriptional Activation Module: Select a product-responsive promoter. For phosphate-sensing, the E. coli phoA promoter (PphoA) is used, which is controlled by the PhoB/PhoR two-component system.
- Reporter Gene: Clone a fast-folding, bright fluorescent protein gene (e.g., sfgfp) downstream of PphoA.
- Constitutive Sensor Expression: On the same plasmid, express the sensor kinase (phoR) and response regulator (phoB) from a weak, constitutive promoter (e.g., J23104).
- Library Expression Module: On a separate plasmid (or same, bicistronic), place the mutant library gene under a tunable, inducible promoter (e.g., PBAD, T7/lac). Use a different antibiotic resistance marker than the reporter plasmid.
B. Cloning Steps (Golden Gate Assembly)
- Fragment Amplification: Using high-fidelity PCR, amplify:
- PphoA-sfGFP fragment.
- Constitutive promoter-phoB-phoR fragment.
- Plasmid backbone with origin of replication and antibiotic resistance (e.g., AmpR).
- Digestion-Ligation: Assemble 50 fmol of each fragment using 10 U of Esp3I (Type IIs enzyme) and 400 U of T7 DNA Ligase in 1x T4 DNA Ligase Buffer. Run the reaction in a thermocycler: 30 cycles of (37°C for 5 min, 16°C for 5 min), then 50°C for 5 min, 80°C for 10 min.
- Transformation: Transform 2 µL of the assembly reaction into 50 µL of high-efficiency competent E. coli. Plate on LB+Ampicillin.
- Validation: Screen colonies by colony PCR and sequence confirmed plasmids. Validate reporter function by co-transforming with a positive control (enzyme-expressing plasmid) and negative control (empty vector) and measuring fluorescence via flow cytometry.
Quantitative Performance Metrics
The following table summarizes typical validation data for a successful phosphatase-activated GFP reporter plasmid in E. coli.
Table 1: Reporter Plasmid Validation Data
| Condition | Mean Fluorescence (a.u.) | Signal-to-Background Ratio | Flow Cytometry CV (%) |
|---|---|---|---|
| Negative Control (No Enzyme) | 520 ± 45 | 1.0 | 8.5 |
| Wild-Type Phosphatase Expressed | 15,800 ± 1,200 | 30.4 | 9.1 |
| Catalytically Dead Mutant | 610 ± 65 | 1.2 | 10.3 |
| Optimal Sort Gate Threshold | > 5,000 a.u. | > 10-fold | < 15% |
Protocol: Construction of a Saturation Mutagenesis Library
Principle
Generate a diverse library of enzyme variants targeted at specific active site or flexible loop residues using NNK codon degeneracy (N=A/T/G/C; K=G/T), which encodes all 20 amino acids and one stop codon.
Detailed Methodology
A. Primer Design and PCR
- Primers: Design forward and reverse primers containing the NNK degenerate codon(s) at the targeted position(s), flanked by ~20 bp of gene-specific sequence. Include overhangs compatible with Golden Gate Assembly.
- PCR: Set up a 50 µL reaction:
- Template DNA (10-50 ng)
- Q5 Hot Start High-Fidelity 2X Master Mix
- Forward & Reverse primers (0.5 µM each)
- Cycle: 98°C 30s; 25 cycles of (98°C 10s, 72°C 20s/kb); 72°C 2 min.
- DpnI Digestion: Add 1 µL of DpnI enzyme directly to PCR product, incubate at 37°C for 1 hour to digest methylated template DNA.
B. Library Assembly and Transformation
- Purify the PCR product using a gel extraction kit.
- Golden Gate Assembly: Use the same method as in 3.2.B, inserting the library fragment into the enzyme expression plasmid backbone.
- Library Transformation: Desalt the assembly reaction and transform into 100 µL of electrocompetent E. coli via electroporation (1.8 kV). Immediately recover in 1 mL SOC media for 1 hour at 37°C.
- Library Amplification: Plate a dilution series to calculate library size. Harvest the remainder of the transformation by centrifugation and perform a plasmid midiprep to obtain the library DNA for downstream sorting.
Library Quality Control Data
Table 2: Mutagenesis Library QC Metrics
| Parameter | Target Value | Typical Result |
|---|---|---|
| Theoretical Diversity (per site) | 32 codons | 32 |
| Transformation Efficiency | > 1 x 10⁸ cfu | 3.5 x 10⁸ cfu |
| Actual Library Size | > 100x Theoretical | 4.2 x 10⁷ clones |
| Sequence Coverage (Sampled n=50) | > 90% Variants | 94% (47/50 unique) |
| Error-Free Clones (Sampled n=20) | 100% | 95% (1 bp error in 1 clone) |
Visualized Workflows and Pathways
The successful isolation of a target-binding clone from a Phase 1 display library is merely the starting point for engineering superior biocatalysts. Phase 2 focuses on transforming the recovered genetic material into a robust, heterologous expression host suitable for high-throughput enzymatic characterization and subsequent directed evolution cycles. This phase bridges the gap between discovery and quantitative analysis, enabling FACS-based sorting for enzyme activity.
Key Objectives:
- Host Transition: Move the gene of interest (GOI) from the display vehicle (e.g., phage, yeast surface) into a flexible expression plasmid for a microbial host (e.g., E. coli, P. pastoris).
- Library Diversification: Introduce targeted diversity through mutagenesis methods to create a second-generation variant library.
- Controlled Expression: Achieve high-yield, soluble expression of enzyme variants for functional screening.
Critical Considerations:
- Expression Host Choice: E. coli BL21(DE3) remains the workhorse for soluble prokaryotic enzyme expression due to its well-characterized genetics and availability of tuning tools (e.g., Lemo21(DE3) for optimizing translation). For disulfide-rich or secreted eukaryotic enzymes, P. pastoris or mammalian systems (HEK293) may be necessary.
- Vector Design: Plasmids must contain inducible promoters (T7, AOX1), selectable markers, and tags (His-tag, HaloTag) for purification and/or FACS labeling.
- Diversity Generation: The method must balance randomness with the preservation of functional scaffolds, focusing mutagenesis on regions identified from Phase 1 binding data.
Table 1: Comparison of Common Mutagenesis Methods for Library Construction
| Method | Principle | Theoretical Library Size | Practical Diversity (Clones) | Mutation Rate (avg. bp changes/variant) | Key Advantage | Primary Limitation |
|---|---|---|---|---|---|---|
| Error-Prone PCR (epPCR) | Low-fidelity PCR with Mn2+ / unbalanced dNTPs | >10^10 | 10^6 – 10^8 | 1 – 5 | Simple, random whole-gene diversity | Bias toward transitions (AG, CT) |
| Site-Saturation Mutagenesis (SSM) | Oligos with NNK/NNG codons at targeted sites | 32 (per site) | ~10^4 – 10^5 (multisite) | Defined (per site) | Comprehensive coverage of all 20 AAs at chosen residues | Limited to pre-defined, focused regions |
| DNA Shuffling | Fragmentation & recombination of homologous genes | >10^100 | 10^7 – 10^9 | Variable, from parents | Recombines beneficial mutations from multiple parents | Requires high sequence homology (>70%) |
| Casting PCR | Use of non-natural nucleoside triphosphate analogs | >10^10 | 10^7 – 10^9 | 1 – 10 | Can access novel chemical space in variants | Requires specialized nucleotides, potential toxicity |
Table 2: Typical Transformation Efficiencies for Common Expression Hosts
| Expression Host | Standard Transformation Method | Average Efficiency (CFU/µg DNA) | Recommended for Library Size |
|---|---|---|---|
| E. coli DH5α (Cloning) | Heat Shock | 1 x 10^7 – 1 x 10^8 | >10^7 variants |
| E. coli BL21(DE3) (Expression) | Electroporation | 1 x 10^9 – 1 x 10^10 | >10^9 variants |
| P. pastoris X-33 | Electroporation | 1 x 10^4 – 1 x 10^5 | ~10^5 variants |
| HEK293F (Transient) | PEI-Mediated Transfection | N/A (% of live cells) | ~10^7 variants (typically 30-80% efficiency) |
Detailed Experimental Protocols
Protocol 3.1: Subcloning and Plasmid Construction for E. coli Expression
Objective: Transfer GOI from display vector to expression vector.
- PCR Amplification: Amplify GOI using primers containing 5' restriction sites (e.g., NdeI, XhoI) and ribosomal binding site (RBS) if needed. Use high-fidelity polymerase.
- Digestion & Purification: Double-digest both PCR product and destination expression vector (e.g., pET series) with selected restriction enzymes. Purify fragments using gel electrophoresis.
- Ligation: Assemble using a 3:1 insert:vector molar ratio with T4 DNA ligase. Incubate at 16°C for 16 hours.
- Transformation: Transform ligation mix into chemically competent E. coli DH5α cells via heat shock (42°C, 45 sec). Recover in SOC media for 1 hour.
- Screening & Validation: Plate on LB-agar with appropriate antibiotic. Screen colonies by colony PCR and validate plasmid by Sanger sequencing.
Protocol 3.2: Generating Diversity by Error-Prone PCR (epPCR)
Objective: Create a random mutant library of the GOI. Reaction Setup (50 µL):
- Template DNA (10-50 ng): 1 µL
- 10X Mutazyme II Buffer: 5 µL
- Mutazyme II DNA Polymerase (2.5 U/µL): 1 µL
- dNTP Mix (0.2 mM each dATP, dGTP; 1 mM each dCTP, dTTP): 5 µL
- Forward/Reverse Primers (10 µM): 2.5 µL each
- MgSO4 (7 mM final): 1 µL
- Nuclease-free H2O: to 50 µL Thermocycling:
- Initial Denaturation: 95°C for 2 min.
- 30 Cycles: 95°C for 30 sec, 55°C for 30 sec, 72°C for 1 min/kb.
- Final Extension: 72°C for 5 min. Post-Processing: Purify PCR product, digest with appropriate restriction enzymes, and ligate into prepared expression vector as in Protocol 3.1.
Protocol 3.3: High-Efficiency Electroporation of E. coli BL21(DE3) for Library Generation
Objective: Achieve maximum transformation efficiency for large variant libraries.
- Cell Preparation: Grow BL21(DE3) in 500 mL LB to an OD600 of 0.5-0.7. Chill on ice for 30 min.
- Washing: Pellet cells at 4°C, 2500 x g for 15 min. Gently resuspend in 500 mL of ice-cold 10% glycerol. Repeat wash step twice, resuspending in 1 mL final volume of 10% glycerol.
- Electroporation: Aliquot 50 µL competent cells into pre-chilled tubes. Add 1-10 ng ligated library DNA. Transfer to a 1 mm electroporation cuvette. Pulse at 1.8 kV, 25 µF, 200 Ω. Immediately add 1 mL SOC media.
- Recovery & Amplification: Recover cells at 37°C with shaking (225 rpm) for 1 hour. Plate aliquots for titer calculation. Use the remaining culture to inoculate a main library culture with antibiotic for plasmid amplification (overnight growth).
- Library Harvest: Isporate library plasmid pool using a miniprep kit for immediate re-transformation or store cells at -80°C in 25% glycerol.
Visualizations
Diagram 1: Phase 2 Experimental Workflow
Diagram 2: Expression Vector Key Elements
The Scientist's Toolkit
Table 3: Key Research Reagent Solutions for Phase 2
| Item | Function & Application | Example Product/Kit |
|---|---|---|
| High-Fidelity DNA Polymerase | Accurate amplification of GOI for subcloning to minimize spurious mutations. | Q5 High-Fidelity (NEB), KAPA HiFi |
| Low-Fidelity / Mutagenic Polymerase | Introduces random mutations during PCR for epPCR library generation. | Mutazyme II (Agilent), Taq Polymerase (with Mn2+) |
| Restriction Enzymes | Site-specific digestion for directional cloning of inserts into vectors. | FastDigest enzymes (Thermo), Golden Gate Assembly mix |
| T4 DNA Ligase | Covalently joins insert and vector DNA fragments post-digestion. | T4 DNA Ligase (NEB), Quick Ligation Kit |
| Electrocompetent E. coli Cells | High-efficiency transformation of large, ligated plasmid libraries. | NEB 10-beta Electrocompetent, homemade BL21(DE3) |
| SOC Outgrowth Media | Rich recovery media post-transformation to ensure cell viability and plasmid expression. | Commercial SOC medium (Thermo) |
| Plasmid Miniprep Kit | Rapid isolation of plasmid DNA from transformed colonies or library pools. | QIAprep Spin Miniprep (Qiagen), Monarch Plasmid Kit |
| NNK Oligonucleotides | Primers for site-saturation mutagenesis to encode all 20 amino acids at a target site. | Custom DNA oligos (IDT, Twist Bioscience) |
| Lemo21(DE3) Competent Cells | Tune T7 RNA polymerase expression to enhance soluble protein yield of toxic enzymes. | Lemo21(DE3) (NEB) |
| HaloTag Ligand | Covalent, cell-permeable fluorescent ligand for labeling enzymes in vivo for FACS sorting. | Janelia Fluor HaloTag Ligands (Promega) |
Within the context of FACS-based screening for enzyme directed evolution, the staining and preparation phase is the critical bridge between engineered cellular function and high-throughput isolation. This phase determines the fidelity of the correlation between enzymatic activity—the phenotype under selection—and the fluorescent signal used for sorting. Imperfect staining leads to false positives, library distortion, and failed evolution campaigns. These Application Notes detail current best practices for live-cell fluorescent labeling, emphasizing protocols optimized for FACS in microbial and mammalian host systems.
Core Principles for Directed Evolution Staining
- Viability Preservation: The assay must maintain cell viability and integrity to ensure sorted cells remain proliferative.
- Signal-to-Noise Maximization: The staining strategy must generate a robust fluorescent signal specifically linked to the enzyme's activity, minimizing background.
- Compatibility with FACS: Fluorophores must be compatible with available laser lines and detectors, and staining must be homogeneous to ensure accurate sorting.
Key Research Reagent Solutions
| Reagent/Category | Function in Enzyme Evolution Staging | Key Considerations |
|---|---|---|
| Esterase-Sensitive Dyes (e.g., Calcein AM) | Cell-permeant, non-fluorescent probe cleaved by intracellular esterases to yield a fluorescent, cell-impermeant product. Serves as a direct readout for esterase enzyme evolution or as a general viability marker. | Loading concentration and incubation time are critical; excessive loading can cause signal saturation and cytotoxicity. |
| Fluorogenic Substrates | Enzyme-specific, non-fluorescent probes that yield a fluorescent product upon catalytic turnover (e.g., MUG for β-galactosidase, Resorufin esters for lipases). The cornerstone of activity-based sorting. | Must be cell-permeant. Km should be suitable for intracellular enzyme concentrations. Product fluorescence should be spectrally distinct from cellular autofluorescence. |
| Membrane Potential Dyes (e.g., DiOC₂(3)) | Indicators of cellular metabolic activity and viability, often used as a secondary gating parameter to exclude dead or stressed cells from the sorted population. | Use at low nanomolar concentrations to avoid toxicity. Signal is sensitive to incubation buffer and temperature. |
| Cell Trace Proliferation Dyes (e.g., CellTrace Violet) | Fluorescent cytoplasmic dyes that dilute equally upon cell division. Used to track post-sort proliferation or to pre-label cells before an assay to monitor culture dynamics. | Requires a quenched stop reaction. Over-labeling can inhibit cell growth. |
| Hanks' Balanced Salt Solution (HBSS) with HEPES | A standard, physiological buffer for washing and resuspending cells during staining. Maintains pH and ion balance without significant metabolic activity. | Pre-warm to assay temperature (e.g., 30°C for yeast, 37°C for mammalian cells) to prevent thermal shock. |
| Bovine Serum Albumin (BSA, 0.1-1%) | Added to staining buffers to reduce non-specific adsorption of dyes to cells and tubing, and to minimize cell clumping. | Use high-purity, low-fluorescent background BSA. Filter sterilize the buffer before use. |
Detailed Protocol: Intracellular Hydrolase Activity Staining for Yeast FACS
Application: Sorting a yeast surface-displayed or intracellular hydrolase library based on activity using a fluorogenic substrate.
Materials
- Yeast library culture, induced for protein expression.
- Appropriate fluorogenic substrate (e.g., fluorescein diacetate (FDA) for esterases).
- Staining Buffer: PBS or HBSS, pH 7.4, with 0.1% BSA.
- Control samples: Uninduced cells, empty vector cells, cells with known positive enzyme.
- Microcentrifuge tubes or 96-well V-bottom plates.
- Incubator/shaker set at culture temperature.
- Ice bath.
- Flow cytometer with appropriate laser/filter sets.
Procedure
Cell Harvest & Wash:
- Harvest 1-5 x 10⁶ cells per sample by centrifugation (3,000 x g, 2 min).
- Gently resuspend and wash cells twice with 1 mL of ice-cold Staining Buffer.
- After final wash, resuspend cells in Staining Buffer to a density of 5 x 10⁷ cells/mL.
Substrate Loading:
- Prepare a working stock of the fluorogenic substrate in anhydrous DMSO. The final concentration must be determined empirically (see Table 1).
- Add 100 µL of cell suspension (5 x 10⁶ cells) to a tube/well.
- Add the appropriate volume of substrate working stock. Vortex or pipette mix immediately.
- Incubate in the dark at the optimal temperature for enzyme activity (e.g., 30°C) for a precisely timed period (typically 10-120 minutes).
Reaction Termination & Cooling:
- Stop the reaction by adding 1 mL of ice-cold Staining Buffer.
- Place samples immediately on ice. This halts enzymatic turnover and stabilizes the fluorescent signal.
- Pellet cells (3,000 x g, 2 min, 4°C) and resuspend in 300-500 µL of ice-cold Staining Buffer for FACS analysis.
- Analyze or sort within 60-90 minutes of staining.
Empirical Optimization Data
Table 1: Example optimization matrix for fluorescein diacetate (FDA) staining of an esterase-expressing yeast library.
| Cell Type | Substrate | Tested Concentrations | Optimal Conc. | Incubation Time | Signal-to-Noise Ratio |
|---|---|---|---|---|---|
| S. cerevisiae (WT) | FDA | 0.5, 5, 50 µM | 5 µM | 30 min | 1.5 (Background) |
| S. cerevisiae (Empty Vector) | FDA | 0.5, 5, 50 µM | 5 µM | 30 min | 2.1 |
| S. cerevisiae (Esterase+) | FDA | 0.5, 5, 50 µM | 5 µM | 30 min | 15.7 |
| S. cerevisiae (Esterase+) | FDA | 5 µM | 15, 30, 60 min | 30 min | 15.7 |
Critical Workflow: From Staining to Sorting
Title: Workflow for Live-Cell Enzymatic Activity Staining Pre-FACS
Fluorescent Signal Generation Pathways in Enzyme Assays
Title: Enzyme Activity to FACS Signal Pathway
Within a thesis on FACS-based sorting for enzyme directed evolution, Phase 4 is the critical translational step where experimental design meets physical cell sorting. This phase defines the parameters that will isolate variants with improved enzymatic function, directly impacting downstream validation and lead candidate identification. Proper instrument setup and a robust gating strategy are paramount for achieving high-purity sorts while maintaining cell viability for subsequent cultivation or analysis.
Instrument Setup: Calibration and Configuration
Optimal sorter performance requires meticulous calibration. The following table summarizes key setup parameters and their target values for a typical 4-laser (488nm, 405nm, 561nm, 640nm) sorter configuration used in enzyme evolution screens.
Table 1: Standard Instrument Setup Parameters for Enzyme Activity Sorting
| Component/Parameter | Setting/Value | Purpose & Rationale |
|---|---|---|
| Nozzle Size | 70 µm or 100 µm | Balances sort speed (70µm) with gentler shear forces and higher viability (100µm). For fragile cells post-transformation, 100µm is often preferred. |
| Sheath Pressure | ~70 psi (100µm nozzle) | Maintains stable laminar flow and consistent droplet break-off. Adjusted in tandem with nozzle choice. |
| Drop Delay | Determined daily via calibration beads | Critical for sort accuracy. Must be re-established after any change to stream stability or nozzle. |
| Laser Alignment (PMT Voltages) | Optimized using calibration beads (e.g., UltraRainbow) | Ensures maximum signal detection and sensitivity. Voltages are set to place negative population in the first decade of log scale. |
| Sort Mode | Purity (Single Cell) or Yield | Purity mode (single cell deposited per well) is essential for clonal outgrowth in 96-/384-well plates for downstream validation. |
| Collection Medium | 96-well plate with rich medium + 20% FBS or 0.5% Pluronic F-68 | Enhances post-sort viability of single cells. Pluronic F-68 protects from shear stress. |
| Sort Temperature | 4°C (collection on chilled block) | Slows cellular metabolism, preserves activity, and maintains viability during extended sort periods. |
Gating Strategy: Defining Populations for Enzyme Function
The gating strategy logically progresses from eliminating debris and aggregates to isolating live, single cells expressing the enzyme library, and finally selecting the top-performing variants based on a functional readout (e.g., fluorescence from a substrate turnover product).
Protocol: Sequential Gating for Enzymatic Activity Sorting
1. Sample Preparation: Cells expressing the enzyme variant library are incubated with a fluorogenic substrate (e.g., a non-fluorescent esterase substrate like fluorescein diacetate or a custom-designed enzyme-specific probe) for a defined period (30 min - 2 hrs) at a physiological temperature. The reaction is stopped by placing samples on ice and adding a quenching buffer (e.g., PBS + 2% FBS).
2. Data Acquisition & Initial Gate (FSC vs SSC):
- Acquire a sufficient number of events (e.g., 100,000-1,000,000).
- Gate P1: Cells vs Debris. Plot Forward Scatter (FSC-A) vs Side Scatter (SSC-A). Draw a polygon gate around the main cell population, excluding low-scatter debris.
3. Single-Cell Discrimination (FSC-H vs FSC-A):
- Gate P2: Single Cells. From P1, plot FSC-Height (FSC-H) vs FSC-Area (FSC-A). Gate on the diagonal population where height and area are proportional. This excludes doublets or cell clumps.
4. Live/Dead Discrimination (Viability Dye):
- Gate P3: Live Cells. From P2, plot fluorescence of a viability dye (e.g., DAPI, PI, or SYTOX) vs FSC-A. Use a dye excluded by live cells. Gate on the negative (non-fluorescent) population.
5. Library Expression Gate (Fluorescent Protein or Surface Tag):
- Gate P4: Expressing Cells. From P3, plot fluorescence of the expression marker (e.g., GFP from expression vector, APC-conjugated anti-His tag) vs SSC-A. Set a threshold gate to isolate cells expressing the enzyme library above background autofluorescence.
6. Functional Activity Gate (Product Fluorescence):
- Gate P5: Active Variants (Sort Gate). From P4, plot the fluorescence signal from the enzymatic product (e.g., fluorescein from FDA hydrolysis: 530/30 nm filter). Set the sort gate to capture the top 0.1% - 5% of fluorescent cells, depending on library diversity and desired hit stringency. This is the final sort population.
7. Control Samples for Gating:
- Negative Control: Untransformed cells or cells expressing an inactive enzyme mutant, incubated with substrate. Used to set the boundary for the "Active" gate (P5).
- Positive Control (if available): Cells expressing a known improved enzyme variant. Used to verify the assay dynamic range and sort gate placement.
The Scientist's Toolkit: Key Research Reagent Solutions
Table 2: Essential Materials for FACS-based Enzyme Evolution Screens
| Item | Function & Rationale |
|---|---|
| Fluorogenic Enzyme Substrate | Core assay component. A non-fluorescent molecule converted to a fluorescent product by enzyme activity (e.g., FDG for β-galactosidase, Coumarin-based esters for esterases/lipases). Must be cell-permeable and specific. |
| Viability Dye (e.g., DAPI, Propidium Iodide) | Distinguishes live from dead cells. Critical for ensuring sorted clones are viable for outgrowth. Used at low concentrations post-substrate incubation. |
| Expression Marker (e.g., GFP, mCherry, APC-anti-His) | Fluorescent reporter co-expressed with the enzyme library or tag fused to it. Allows gating on cells successfully transfected/transformed and expressing the target library. |
| Sort Collection Medium | Sterile, protein-rich medium (e.g., growth medium + 20-50% FBS, 1% Pen/Strep) or PBS + 0.5% Pluronic F-68. Protects cells during sorting and increases post-sort recovery. |
| Calibration Beads (e.g., UltraRainbow, AlignFlow) | Polystyrene beads of known size and fluorescence intensity. Essential for daily instrument setup: laser delay calibration, PMT voltage optimization, and compensation. |
| High-Recovery 96-/384-Well Plates | Tissue-culture treated plates, often with round-bottom wells, pre-filled with growth medium. Optimized for recovering and outgrowing single deposited cells. |
| Quenching/Wash Buffer (PBS + 2% FBS) | Stops the enzymatic reaction during incubation and reduces non-specific cell clumping. FBS reduces cell adhesion to tube walls. |
Advanced Considerations: Index Sorting and Multiparameter Analysis
For complex enzyme engineering campaigns, advanced strategies are employed:
- Index Sorting: Records the complete fluorescence profile (FSC, SSC, all channels) of each individual cell as it is sorted into a well. This allows retrospective analysis of pre-sort characteristics of every recovered clone, linking sequence data to a multi-parametric phenotype.
- Multiplexed Substrates: Using two spectrally distinct substrates can enable sorting for multiple enzymatic properties simultaneously (e.g., activity and selectivity).
Protocol: Pre-Sort Instrument QC and Validation
Objective: Ensure sorter is optimally configured for a high-purity, high-viability sort. Steps:
- Startup & Sterilization: Perform fluidics startup and sterilization cycle according to manufacturer guidelines.
- Nozzle Installation & Stream Check: Install chosen nozzle (e.g., 100µm). Align stream to center of the laser intercept point. Check for stable, laminar flow.
- Drop Delay Calibration: Using calibration beads (e.g., Accudrop), determine the precise drop delay value. This is the number of drops between the laser interrogation point and the charging point. Re-check after any disturbance.
- PMT Voltage Optimization: Run brightly fluorescent calibration beads (e.g., 3-5 peak beads). Adjust PMT voltages for all detectors so the brightest population is in the upper third of the logarithmic scale and the negative population is in the first decade.
- Compensation Setup: Run single-color control samples (e.g., beads or stained cells) for each fluorophore used in the experiment. Use software to calculate and apply spectral overlap (compensation) matrix.
- Sort Efficiency Test: Perform a test sort using a mixture of cells with distinct fluorescence (e.g., GFP+ and GFP- cells) into two collection tubes. Re-analyze sorted fractions to determine purity (typically >95% target) and yield.
- Sample Preparation Final Check: Prior to loading the experimental library, re-analyze the positive and negative control samples to confirm the gating strategy and expected signal separation.
Within a FACS-based directed evolution pipeline for enzyme engineering, Phase 5 represents the critical execution step where genetic libraries are physically partitioned based on phenotypic activity. This phase directly links the designed assay (Phase 4) to the recovery of improved variants. The strategies employed here dictate the efficiency, fidelity, and ultimate success of the evolutionary campaign, balancing the need to recover rare, high-performing clones against the purity and viability of the sorted population.
Enrichment Strategies for Enzyme Evolution
The choice of enrichment strategy is dictated by the screening goal and library diversity.
| Strategy | Objective | Typical Sort Gate | Application in Enzyme Evolution |
|---|---|---|---|
| Bulk Enrichment | Increase the proportion of active variants from a large, naive library. | Top 5-20% of expressing cells. | First round sorts from large, diverse libraries (e.g., error-prone PCR libraries) to remove inactive clones. |
| "Chipping" | Gradually increase stringency over successive rounds. | Incrementally tighten gate around the top performing tail. | Iterative evolution; gates are tightened each round based on the best population from the previous sort. |
| Single-Cell Precision Isolation | Isolate individual, top-performing clones for sequencing and characterization. | Tight gate around the top 0.1-1% of events. | Final sorting round to isolate discrete lead variants for downstream validation and sequencing. |
| Negative Sort | Deplete the population of undesired phenotypes (e.g., high background, inactive). | Gate set to exclude cells above/below a threshold. | Removing auto-fluorescent cells or host cells with protease leakiness before a positive selection sort. |
Sorting Modes: Precision vs. Yield
The sorter's operational mode is a fundamental trade-off between purity and cell viability.
| Parameter | Purity Mode | Yield Mode | Enrichment Mode |
|---|---|---|---|
| Primary Goal | Maximum post-sort purity (>99%). | Maximum recovery of target cells. | Balanced recovery and purity. |
| Drop Delay | Actively, frequently validated and adjusted. | Less critical, fixed conservative value. | Periodically validated. |
| Sheath Pressure | Typically lower for larger nozzle (e.g., 70µm, 45 PSI). | Can be higher for faster processing. | Intermediate. |
| Nozzle Size | Often larger (e.g., 100µm) for gentle handling. | Smaller (e.g., 70µm) for higher speed. | Chosen based on cell type. |
| Sort Rate | Lower to ensure accuracy. | Higher, accepting some impurity. | Moderate. |
| Best for Enzyme Evolution | Final clone isolation, where purity is paramount. | Early bulk enrichment rounds, maximizing diversity recovery. | Intermediate rounds of "chipping." |
Experimental Protocol: Sort Mode Comparison for a Library Sort
- Objective: Determine the optimal sort mode for the first enrichment round of a hydrolase library.
- Procedure:
- Sample Preparation: Induce enzyme expression in the library and stain with the fluorescent product analog (e.g., fluorescein-diphosphate for phosphatases).
- Instrument Setup: Use a 100µm nozzle for gentler handling. Establish a sort gate on a FSC vs. FL1 plot to capture the top 10% fluorescent population.
- Test Sorts:
- Yield Mode Test: Sort 100,000 events into 1 mL of recovery media in a tube. Record actual sort time and estimated purity.
- Purity Mode Test: Using the same gate, sort for "Single Cell" purity into a 96-well plate prefilled with media. Record time.
- Analysis: Plate sorted cells for colony growth. For tube sort, assess enrichment via bulk fluorescence or PCR; for plate sort, pick 20 colonies, grow, and re-assay to determine "hit rate" (purity).
- Decision: If hit rate from Purity Mode is >90%, use it. If it's low but Yield Mode showed strong bulk enrichment, use Enrichment or Yield mode for the next round to recover more diversity.
Quantitative Data: Impact of Sort Mode on Outcome
Table 1: Simulated Sort Outcomes for a 0.1% Hit Library
| Sort Mode | Events Sorted | Target Events Sorted | Theoretical Purity | Post-Sort Viability | Effective Clones Recovered* |
|---|---|---|---|---|---|
| Yield | 10,000,000 | 10,000 | ~10% | 70% | ~700 |
| Enrichment | 5,000,000 | 5,000 | ~80% | 85% | ~3400 |
| Purity (Single-Cell) | 500,000 | 500 | >99% | 95% | 475 |
*Assumes a Poisson distribution for cell deposition. Effective Clones = (Target Events Sorted) x (Post-Sort Viability) x (Purity factor).
Post-Sort Handling: From Droplet to Clone
Proper recovery is as critical as the sort itself.
Experimental Protocol: Recovery and Expansion of Sorted Cells
- Materials: Sterile collection tubes/plates with pre-aliquoted rich recovery media (e.g., SOC for E. coli + 1% glucose to repress induction). Incubator/shaker.
- Procedure for Bulk Sorts (Tube):
- Collect sorted cells in a 5 mL tube with 1 mL pre-warmed recovery media.
- Immediately place tube at 37°C with shaking (250 rpm) for 1-hour outgrowth.
- Transfer to a flask with selective antibiotic media (e.g., LB+Amp) and grow to saturation for plasmid extraction or for the next induction/sort round.
- Procedure for Single-Cell Sorts (Plate):
- Collect single cells into a 96- or 384-well plate prefilled with 100-200 µL of rich media per well.
- Seal the plate with a breathable membrane or lid. Incubate statically at 37°C for 2 hours, then shake for 4-6 hours.
- Using a multichannel pipette, replicate plate into a deep-well plate containing induction media for expression and re-screening to confirm phenotype.
The Scientist's Toolkit: Key Reagent Solutions
| Item | Function in Phase 5 |
|---|---|
| Cell Recovery Media (e.g., SOC, TB) | Nutrient-rich, non-selective medium to repair cell wall damage and restore growth post-sort. |
| Collection Tube/Plate Additives (e.g., FBS, 1% Glucose) | Fetal Bovine Serum or sugars increase viability and suppress premature protein induction in collection vessels. |
| Antibiotic-Free Media | Used for final collection to prevent killing cells during the vulnerable recovery period. |
| Penicillin-Streptomycin (Pen-Strep) | Added to collection tubes for mammalian cell sorts to prevent bacterial contamination. |
| Cloning-Grade Agar Plates | For plating diluted bulk sorts to obtain single colonies for screening. |
| Deep-Well 96/384-Well Plates | For high-throughput culture expansion of single-cell sorted clones. |
Visualizations
Enzyme Evolution FACS Sort Strategy Flow
Decision Logic: Choosing a FACS Sort Mode
In the context of a FACS-based directed evolution campaign, Phase 6 represents the critical transition from enriched, sorted cell pools to the identification and characterization of discrete, improved enzyme variants. This phase involves validation of sorting efficacy, isolation of single clones, functional re-testing, and sequence analysis to elucidate the molecular basis for improved activity or selectivity, ultimately delivering lead candidates for downstream drug development applications.
Validation of Sorted Pools: Assessing Enrichment
The first step is to quantitatively assess the enrichment achieved through one or more rounds of FACS. This confirms the success of the sorting strategy before committing resources to single-clone isolation.
Protocol 2.1: Bulk Activity Assay of Pre- and Post-Sort Pools
- Cell Preparation: Inoculate separate liquid cultures from the glycerol stocks of the pre-sort library (or previous round pool) and the sorted pool. Grow under identical induction conditions.
- Cell Normalization: Harvest cells at mid-log phase. Normalize cultures to identical optical density (OD600).
- Activity Measurement: For a fluorogenic substrate assay, distribute normalized cell suspension into a black-walled microplate. Add substrate at the established KM concentration. Immediately measure fluorescence (Ex/Em appropriate to product) kinetically over 10-30 minutes using a plate reader.
- Data Analysis: Calculate the initial linear rate (RFU/sec) for each pool. Normalize rates to cell count (via OD600). The fold-enrichment is calculated as: (RatePost-Sort / RatePre-Sort).
Table 1: Representative Enrichment Data from a FACS Campaign for a Hydrolase
| Sorting Round | Pool Designation | Normalized Activity (RFU/sec/OD600) | Fold-Enrichment vs. WT | Estimated Library Diversity |
|---|---|---|---|---|
| 0 | Wild-Type (WT) | 1.0 ± 0.2 | 1.0 | 1 |
| 0 | Naive Library | 0.8 ± 0.3 | 0.8 | 5.0 x 10^7 |
| 1 | Gate: Top 0.5% | 5.5 ± 1.1 | 5.5 | 2.5 x 10^5 |
| 2 | Gate: Top 0.2% | 32.0 ± 4.5 | 32.0 | 5.0 x 10^3 |
| 3 | Gate: Top 0.1% | 210.0 ± 25.0 | 210.0 | ~500 |
Isolation and Validation of Single Variants
Positive pools are plated for single colonies, which are individually screened to identify the top-performing hits.
Protocol 3.1: Single-Clone Isolation and Primary Screening
- Plating: Perform serial dilutions of the final sorted pool and plate on non-inducing agar to obtain ~100-200 well-isolated colonies.
- Culture Growth: Pick 96-384 individual colonies into deep-well plates containing growth medium. Grow to saturation.
- Expression Induction: Using a replication tool, inoculate a new expression plate from the master plate. Induce enzyme expression.
- High-Throughput Activity Screen: Normalize induced cultures and transfer to an assay plate. Add fluorogenic substrate. Measure endpoint fluorescence or initial rates. Select the top ~24-48 clones (e.g., those with activity >3 standard deviations above the plate median) for secondary validation.
Protocol 3.2: Secondary Validation in Biological Triplicate
- Liquid Culture Regrowth: Inoculate 3 separate liquid cultures for each selected hit and relevant controls (WT, library pool).
- Full Kinetic Analysis: Harvest induced cells, normalize, and assay with a range of substrate concentrations.
- Data Analysis: Plot initial velocity vs. substrate concentration. Fit data to the Michaelis-Menten model (v = Vmax * [S] / (KM + [S])) using non-linear regression software (e.g., Prism, GraphPad).
- Key Metrics: Determine apparent kcat (Vmax/[E]) and KM. Calculate catalytic efficiency (kcat/KM).
Table 2: Kinetic Parameters of Isolated Hits from a Directed Evolution Campaign
| Variant ID | Mutation(s) | KM (µM) | Apparent kcat (s^-1) | kcat/KM (µM^-1 s^-1) | Fold-Improvement (kcat/KM vs. WT) |
|---|---|---|---|---|---|
| WT | - | 250 ± 25 | 1.0 ± 0.1 | 0.0040 | 1.0 |
| 6B4 | A121V, F185L | 180 ± 18 | 3.5 ± 0.2 | 0.0194 | 4.9 |
| 11H7 | A121V, F185L, D203N | 95 ± 8 | 8.2 ± 0.4 | 0.0863 | 21.6 |
| 12A1 | P45S, A121V, F185L | 310 ± 30 | 15.0 ± 0.9 | 0.0484 | 12.1 |
| 23F9 | A121V, F185L, D203N, G255S | 110 ± 10 | 22.5 ± 1.5 | 0.2045 | 51.1 |
Sequence Analysis and Phylogenetics
Sequencing hits reveals beneficial mutations and allows for the construction of sequence-activity relationships (SAR).
Protocol 4.1: Sequencing and Analysis
- PCR Amplification: Amplify the variant gene from colony PCR or plasmid prep of validated hits.
- Sanger Sequencing: Sequence using forward and reverse primers flanking the gene. For variants from later rounds with multiple mutations, use primer walking if necessary.
- Sequence Alignment: Align all variant sequences to the wild-type using software (e.g., Geneious, SnapGene). Identify all amino acid substitutions.
- Mutation Frequency Analysis: Tabulate the occurrence of each mutation across all sequenced hits to identify conserved, beneficial changes (e.g., A121V and F185L in Table 2).
Protocol 4.2: Construction of a Phylogenetic Tree
- Multiple Sequence Alignment: Perform a Clustal Omega alignment of the protein sequences of all hits and WT.
- Tree Building: Use the alignment to generate a neighbor-joining or maximum-likelihood phylogenetic tree (e.g., with MEGA XI software).
- Visualization: Annotate the tree branches with the observed mutations and color-code clades based on functional performance (e.g., catalytic efficiency).
The Scientist's Toolkit: Key Research Reagent Solutions
Table 3: Essential Materials for Phase 6 Analysis
| Item | Function & Rationale |
|---|---|
| Black/Clear Bottom 384-Well Assay Plates | Low-volume, high-throughput format for primary screening of single clones; black walls minimize optical cross-talk for fluorescence assays. |
| Liquid Handling Workstation (e.g., Integra Viaflo) | Enables rapid, precise replication of cultures, normalization, and assay assembly, improving throughput and reproducibility. |
| Multi-Mode Microplate Reader (e.g., BioTek Synergy H1) | Measures fluorescence, absorbance, and luminescence for kinetic and endpoint assays on single clones. |
| Non-Linear Regression Software (e.g., GraphPad Prism) | Essential for robust fitting of kinetic data (Michaelis-Menten, dose-response curves) to extract KM, Vmax, and IC50 values. |
| Sanger Sequencing Services (e.g., Azenta, Eurofins) | Provides fast, accurate DNA sequence data for identifying mutations in isolated hits. |
| Sequence Analysis Software (e.g., Geneious Prime) | Integrates sequence alignment, mutation calling, annotation, and primer design in a single platform. |
| Phylogenetic Analysis Tool (e.g., MEGA XI) | Free, powerful software for constructing and visualizing phylogenetic trees from variant sequences. |
| Glycerol Stocks (of validated hits) | Long-term, stable archival of engineered variants for future characterization or additional rounds of evolution. |
Visualizing the Phase 6 Workflow and Sequence-Structure-Function Relationship
Phase 6: Hit Isolation & Analysis Workflow
Sequence to Function Logic Loop
Optimizing Your FACS Screen: Solving Common Pitfalls and Maximizing Signal-to-Noise
Within the critical workflow of fluorescence-activated cell sorting (FACS) for enzyme directed evolution, the primary challenge to achieving high-throughput enrichment of improved variants is achieving robust separation between positive and negative populations. Poor separation, characterized by low fluorescence signal and high background noise, severely compromises sorting purity, efficiency, and the ability to discriminate subtle functional improvements. This document outlines a systematic diagnostic approach and provides detailed protocols to resolve these issues, ensuring the integrity of FACS-based screening campaigns.
Diagnostic Framework & Quantitative Benchmarks
A structured diagnostic begins with quantifying the quality of separation using standard flow cytometry metrics. The following table summarizes key parameters, their optimal ranges, and typical problem values.
Table 1: Quantitative Metrics for Assessing FACS Separation Quality
| Metric | Formula / Description | Optimal Range | Problem Range (Poor Separation) | Implications for Directed Evolution |
|---|---|---|---|---|
| Signal-to-Background Ratio (S/B) | Mean Fluorescence Intensity (MFI) of Positive Population / MFI of Negative Population | > 10 | < 5 | Variants with modest improvements are indistinguishable from wild-type. |
| Signal-to-Noise Ratio (S/N) | (MFIPositive - MFINegative) / SD_Negative | > 5 | < 3 | High false-positive rate during sorting, leading to library dilution. |
| Separation Index (SI) | (MFIPositive - MFINegative) / (2 * (SDPositive + SDNegative)) | > 2 | < 1 | Poor resolution between populations, leading to low purity sorts. |
| Coefficient of Variation (CV) of Negative Population | (SDNegative / MFINegative) * 100 | < 20% | > 30% | High background noise obscures low-expressing positives. |
| Sorting Efficiency | (Number of sorted target events / Total number of sorted events) * 100 | > 90% | < 70% | Wasted resources and time on non-productive sorts. |
Detailed Diagnostic Protocols
Protocol 3.1: Systematic Troubleshooting of Low Fluorescence Signal
Objective: To identify and rectify causes of insufficient specific fluorescence signal from the enzyme variant of interest.
Materials:
- Cells expressing the enzyme-fluorescence reporter construct.
- Relevant substrate for the enzymatic reaction (if using a fluorogenic assay).
- Positive control (e.g., a known high-activity variant).
- Negative control (e.g., empty vector or catalytically dead mutant).
- Flow cytometry staining buffer (PBS + 2% FBS).
Procedure:
- Control Validation:
- Analyze positive and negative control samples. Confirm the positive control yields a high, distinct population. If not, the core assay/construct is faulty.
- Substrate Kinetics & Concentration:
- Perform a time-course experiment. Incubate cells with the fluorogenic substrate and analyze samples at 0, 15, 30, 60, and 120 minutes. Signal may require longer incubation.
- Perform a substrate titration (e.g., 1 µM to 100 µM) to identify the optimal, non-saturating concentration that maximizes S/B.
- Expression & Maturation Check:
- If using a fluorescent protein (FP) reporter, verify FP maturation time. Harvest cells at different time points post-induction (e.g., 4, 8, 16, 24 hours).
- Analyze expression of the enzyme tag via an antibody stain (if available) to distinguish between low expression and low catalytic activity.
- Instrument Calibration:
- Run calibration beads daily. Ensure the photomultiplier tube (PMT) voltage for the relevant detector is set appropriately using the negative control to position its peak on scale.
Table 2: Research Reagent Solutions for Signal Enhancement
| Reagent / Material | Function | Example & Notes |
|---|---|---|
| Cell-Permeant Fluorogenic Substrate | Enters live cells and is converted by intracellular enzyme to a fluorescent product. | C12FDG (for β-galactosidase); Resorufin-based esters (for esterases/lipases). |
| Fluorescence-Activated Substrate (FACS substrate) | Designed for high sensitivity and specificity in live-cell sorting applications. | Sortase A substrates (e.g., LPETG-fluorophore conjugates). |
| Cocktail of Protease Inhibitors | Prevents enzymatic degradation of the reporter or enzyme of interest within cells. | cOmplete, EDTA-free (Roche). Use during cell lysis or for sensitive extracellular enzymes. |
| Chaperone Expression Plasmids | Co-express to improve folding and functional expression of heterologous enzyme variants. | pGro7 (GroEL/ES), pTf16 (DnaK/DnaJ/GrpE) for E. coli. |
| Flow Cytometry Calibration Beads | Standardize instrument performance, ensure day-to-day reproducibility. | Rainbow Calibration Particles (Spherotech), Cytometer Setup & Tracking Beads (BD). |
Protocol 3.2: Mitigating High Background Noise
Objective: To identify sources of non-specific fluorescence and implement strategies to reduce background.
Materials:
- Negative control cells.
- Substrate only (no cells control).
- Enzyme inhibitor (specific or broad-spectrum).
- Serum-free or defined media.
- DNase/RNase-free water for buffer preparation.
Procedure:
- Identify Source of Background:
- Autofluorescence: Analyze unstained negative control. Compare fluorescence in relevant detector to a non-fluorescent cell type.
- Substrate Autolysis/Hydrolysis: Incubate substrate in culture medium with no cells. Analyze supernatant fluorescence over time.
- Non-Specific Substrate Cleavage: Treat negative control cells with a potent inhibitor of the target enzyme class during substrate incubation. A significant signal drop indicates non-specific activity.
- Carryover or Contamination: Run sheath fluid and a water sample through the sorter. Check for particulate/fluorescent events.
- Implement Reduction Strategies:
- Media Optimization: Use serum-free or low-fluorescence media. Filter all media/buffers through a 0.22 µm filter.
- Wash Steps: Post-substrate incubation, wash cells 2-3 times with ice-cold, substrate-free flow cytometry buffer.
- Inhibitor Cocktails: Include non-specific protease/phosphatase inhibitors in wash buffers if enzyme release is suspected.
- Gating Strategy: Use stringent forward scatter (FSC) vs. side scatter (SSC) gates to exclude debris and dead cells (which have high autofluorescence). Use a viability dye (e.g., propidium iodide) to exclude dead cells.
- Voltage Optimization: Reduce PMT voltage on the target detector to bring the negative population closer to the axis without compressing the positive signal.
Optimized Workflow for FACS-Based Enzyme Evolution
The following diagram outlines the integrated diagnostic and optimization workflow within the directed evolution cycle.
Diagram Title: Workflow for Diagnosing and Fixing FACS Separation Issues.
Understanding the biochemical pathway is key to targeted troubleshooting.
Diagram Title: Signal Generation vs. Background Noise Pathways.
Application Notes: FACS-Based Sorting for Enzyme Evolution
Directed evolution of enzymes for drug development relies on generating and screening vast genetic libraries. Fluorescence-Activated Cell Sorting (FACS) enables ultra-high-throughput screening (uHTS) by linking enzyme function to a fluorescent signal. A critical, often overlooked, challenge is the loss of library diversity during sorts—phenomena known as "sorting bottlenecks." This leads to the premature convergence on a few highly expressed clones rather than the best catalysts, sacrificing potential hits and limiting functional diversity for downstream development.
These bottlenecks arise from:
- Expression Noise: Variability in cellular fluorescence due to differences in transcription, translation, and host physiology, not catalytic efficiency.
- Threshold-Based Gating: Applying a single, stringent fluorescence gate that selects only the top 0.1-1% of events, effectively performing a population bottleneck.
- Regrowth Bias: Differential growth rates of sorted variants between sort rounds.
The strategic use of "sort gates"—specifically, multidimensional, dynamic, and tiered gating protocols—is essential to preserve a representative subset of the functional library, ensuring the exploration of a broader sequence space.
Quantitative Analysis of Sorting Strategies
Table 1: Impact of Gating Strategy on Library Diversity Post-Sort
| Gating Strategy | Theoretical % of Library Sorted | Estimated Diversity Retained* | Risk of Bottleneck | Best Use Case |
|---|---|---|---|---|
| Single Stringent Gate (Top 0.5%) | 0.5% | Very Low (<5%) | Very High | Final enrichment round of a highly polished library. |
| Single Moderate Gate (Top 5%) | 5% | Moderate (~20-40%) | High | Middle rounds after initial enrichment. |
| Tiered Gates (e.g., 0.1%, 1%, 5%) | ~6.1% | High (>60%) | Low | Early and middle rounds to maintain diversity. |
| Dynamic, Adaptive Gates | Variable (1-10%) | Very High (>80%) | Very Low | Any round, especially with unknown library behavior. |
| Random Collection (No Gate) | 100% | 100% | None | Control experiment to assess baseline diversity. |
*Estimated percentage of unique functional variants from the parent library that survive the sort, accounting for expression noise and regrowth bias.
Table 2: Key FACS Parameters for Diversity Management
| Parameter | Typical Setting (Stringent) | Recommended for Diversity | Rationale |
|---|---|---|---|
| Sort Mode | Purity | Yield or "Purity-Yield" | Maximizes number of cells/events collected to populate a diverse pool. |
| Events Sorted | 1-5x10⁶ | 10-50x10⁶ | Larger sorted pools mitigate stochastic loss of rare variants. |
| Nozzle Size | 70 µm | 100 µm | Lower shear stress, higher cell viability post-sort. |
| Sheath Pressure | High (~70 psi) | Lower (~45 psi) | Improves viability for fragile, expressing cells. |
| Collection Medium | PBS | Rich Medium + Carrier | Supports immediate cell recovery and reduces post-sort death. |
Detailed Experimental Protocols
Protocol 1: Tiered Gating for Early-Round Library Sorting
Objective: To fractionate a library based on fluorescence intensity into multiple bins, ensuring collection of variants with a wide range of expression and activity.
Materials:
- FACS sorter (e.g., BD FACSAria III, Sony SH800).
- Library of cells expressing enzyme variants (e.g., E. coli or yeast).
- Fluorescent substrate (e.g., fluorescein diacetate for esterases, coumarin-derived substrates for amidases).
- Appropriate growth and collection media.
- ɣ-irradiated or filtered collection tubes with rich media.
Procedure:
- Induction & Preparation: Induce enzyme expression per library protocol. Incubate cells with fluorogenic substrate under Km conditions (substrate concentration at or below Km) to ensure signal is sensitive to catalytic efficiency.
- Control Samples: Prepare and stain (a) negative control (empty vector/host cell), (b) positive control (wild-type enzyme), (c) ultra-positive control (known improved variant, if available).
- FACS Setup: Create a dot plot of FSC-A vs. SSC-A and gate on healthy, single cells (P1). Create a histogram of fluorescence (e.g., FITC-A).
- Define Tiered Gates:
- Gate R1 (Elite): Top 0.1-0.5% of fluorescence, based on positive control.
- Gate R2 (High): Next 2-4% of fluorescence.
- Gate R3 (Medium): Next 5-10% of fluorescence.
- (Optional) Gate R4 (Low): A gate just above the negative control population.
- Sorting: Sort a predetermined number of events (e.g., 10⁶ events for R1, 5x10⁶ for R2, 10⁷ for R3) from the same source tube into separate collection tubes. Use "Yield" mode for R2/R3.
- Recovery & Analysis: Pool cells from R2 and R3 gates for regrowth. Culture R1 cells separately. Plate a fraction of each population to assess colony diversity and sequence a sample of clones from each gate to monitor sequence space.
Protocol 2: Dynamic, Adaptive Gating Based on Population Statistics
Objective: To algorithmically define sort gates based on real-time library statistics, preventing arbitrary threshold setting.
Materials:
- As in Protocol 1, with a sorter capable of real-time statistical analysis or offline analysis software (e.g., FlowJo).
- Pre-established criteria (e.g., "collect population above 3 standard deviations from the library mean").
Procedure:
- Initial Run & Analysis: Run ~100,000 library events without sorting. Record the median fluorescence intensity (MFI) and standard deviation (SD) of the fluorescent population.
- Gate Definition:
- Calculate threshold values: Threshold1 = MFI + (3 * SD); Threshold2 = MFI + (1.5 * SD).
- Create two gates: a stringent gate (above Threshold1) and a diversity gate (between Threshold1 and Threshold_2).
- Validation with Controls: Run positive and negative controls to ensure gates are contextually meaningful. Adjust multiplier for SD if necessary.
- Sort Execution: Sort the predetermined number of events from both gates. The diversity gate ensures collection of promising variants that may have lower expression but high specific activity.
- Iterative Adaptation: In subsequent sort rounds, repeat steps 1-4. The gates will automatically adjust as the library evolves and the population MFI shifts, preventing fixation on an absolute fluorescence value.
Visualizations
Diagram 1: Tiered Gating Workflow for Diversity
Diagram 2: Dynamic Adaptive Gating Logic
The Scientist's Toolkit: Research Reagent Solutions
Table 3: Essential Reagents for FACS-Based Enzyme Evolution
| Reagent / Material | Function & Rationale | Example Product/Chemical |
|---|---|---|
| Permeabilization Agents | Gently permeabilize cell membranes to allow fluorogenic substrate entry for intracellular enzymes. Critical for throughput. | Polymyxin B nonapeptide, Tris-EDTA, low-concentration digitonin. |
| Live/Dead Viability Dyes | Distinguish and gate out dead cells which show non-specific esterase activity and cause false positives. | Propidium Iodide (PI), SYTOX dyes, DAPI (for fixed cells). |
| Fluorogenic Substrates | Enzyme activity reporters. Must be cell-permeant or used with permeabilization. Signal should be proportional to kcat/Km. | Fluorescein diacetate (esterases), Resorufin/Coumarin derivatives (hydrolases), Amplex Red (oxidases). |
| Quenchers / Inhibitors | Rapidly stop the enzymatic reaction post-incubation to "freeze" the fluorescence signal, ensuring sort fidelity. | Specific enzyme inhibitors (e.g., PMSF for serine proteases) or broad-spectrum quenching buffers. |
| Carrier Molecules | Reduce non-specific cell adhesion to sort tubing and collection vessels, improving yield and viability. | Pluronic F-68, Bovine Serum Albumin (BSA), in collection media. |
| ɣ-Irradiated Collection Media | Sterile, ready-to-use media for cell collection that supports immediate recovery without the need for post-sort centrifugation. | ɣ-irradiated LB or TB broth with 0.01% Pluronic F-68. |
| Cloning/Growth Enhancers | Added to post-sort cultures to outcompete faster-growing contaminants and support all sorted variants. | Antibiotics for plasmid maintenance, auto-induction media for consistent expression. |
Application Notes
Within the context of FACS-based sorting for enzyme directed evolution, managing host and display system-specific challenges is paramount for constructing high-quality, functional libraries. This document outlines key bottlenecks—expression toxicity, secretion inefficiency, and surface display heterogeneity—and provides contemporary solutions. The central thesis is that by systematically addressing these challenges, researchers can create more diverse and functional enzyme libraries, thereby significantly improving the success rate of FACS-enabled directed evolution campaigns for drug discovery and industrial biocatalysis.
Expression Toxicity
Toxic enzyme expression can lead to host cell stress, poor growth, and library bias, as cells expressing functional but harmful variants are counterselected. Recent strategies focus on tight transcriptional control and host engineering.
Key Data Summary:
| Strategy | Host System | Typical Fold Improvement in Library Size | Key Reference (2020-2024) |
|---|---|---|---|
| Titratable Promoters (e.g., PBAD, T7/lac) | E. coli | 10-50x | Chen et al., 2022 |
| Toxin-Antitoxin Stabilized Plasmids | E. coli | Up to 100x | Li & Z., 2023 |
| Genomic Integration (Single Copy) | S. cerevisiae | 5-20x | Gupta et al., 2021 |
| CRISPRi-Medated Transcriptional Tuning | B. subtilis | 30-100x | Park et al., 2024 |
Secretion Issues
Efficient secretion is critical for surface display and for accessing extracellular substrates. Leaky or inefficient secretion systems result in intracellular accumulation, mislocalization, and poor display.
Key Data Summary:
| Secretion Signal | Host | Reported Efficiency (%) | Common Issues |
|---|---|---|---|
| PelB | E. coli (Sec) | 40-70 | Periplasmic accumulation |
| OmpA | E. coli (Sec) | 50-75 | Jamming, misfolding |
| α-factor | S. cerevisiae | 60-85 | Hyperglycosylation |
| YidC pathway | E. coli (SRP) | 30-50 | Limited capacity |
| Tat signal (TorA) | E. coli (Tat) | 20-40 | Slow, folded substrate only |
Surface Display Efficiency
The efficiency with which a properly folded enzyme is presented on the cell surface dictates the signal-to-noise ratio in FACS sorting. This depends on the anchor protein, its copy number, and cellular processing.
Key Data Summary:
| Display System | Anchor Protein | Estimated Copies/Cell | Key Advantage for FACS |
|---|---|---|---|
| Bacterial Autodisplay | IgA protease | 10,000-50,000 | High valency |
| Gram-positive display | Protein A (SpA) | 5,000-20,000 | Robust anchoring |
| Yeast Aga system | Aga1p-Aga2p | 50,000-100,000 | Uniform display |
| Ice Nucleation Protein (INP) | INP-N/C domain | 5,000-15,000 | Facilitates large enzymes |
| Lpp-OmpA fusion | Lpp-OmpA | 10,000-30,000 | Well-characterized |
Protocols
Protocol 1: Titratable Expression for Toxic Enzymes inE. coli(FACS Library Prep)
Objective: To construct a plasmid library of a potentially toxic enzyme while maintaining host viability, enabling the generation of a representative library for surface display and sorting.
Materials:
- pBAD/Myc-His A Vector or similar arabinose-inducible system.
- Electrocompetent E. coli MC4100 or similar with intact Sec machinery.
- 20% (w/v) L-Arabinose stock (filter sterilized).
- 20% (w/v) D-Glucose stock (filter sterilized).
- 2x YT media (with appropriate antibiotics).
- Library transformation by electroporation.
Method:
- Clone the enzyme gene library, fused to your chosen secretion signal and surface anchor (e.g., Lpp-OmpA), into the pBAD vector downstream of the araBAD promoter.
- Perform electroporation of the ligation/assembly mixture into electrocompetent E. coli. Immediately add 1 mL of SOC medium with 0.2% glucose to repress basal expression during recovery.
- Recover cells for 1 hour at 37°C with shaking.
- Plate serial dilutions on LB-agar plates containing antibiotic and 0.2% glucose to determine transformation efficiency. Incubate at 37°C.
- For library expansion, inoculate the remainder of the recovery culture into a large volume (e.g., 50 mL) of 2x YT with antibiotic and 0.1% glucose (mild repression). Grow at 30°C to mid-log phase.
- Induce display by adding arabinose to a low, optimized concentration (e.g., 0.002% - 0.02%). Continue incubation at 25°C for 16-20 hours to allow surface display.
- Harvest cells for FACS sorting using a fluorescent substrate or activity-based probe.
Protocol 2: Assessing and Optimizing Secretion Efficiency in Yeast
Objective: To quantify the fraction of enzyme successfully secreted and displayed versus retained intracellularly, enabling troubleshooting of the secretion pathway.
Materials:
- S. cerevisiae EBY100 strain harboring pCTCON2-based display plasmid.
- SD/-Trp/-Ura medium with 2% glucose (repression) and 2% galactose (induction).
- Buffer: PBS pH 7.4, 1% BSA.
- Anti-c-Myc epitope tag antibody (primary, detects Aga2p-fused enzyme).
- FITC-conjugated anti-mouse antibody (secondary).
- Zymolyase or Lyticase for cell wall digestion.
- Flow cytometer.
Method:
- Induce expression by shifting log-phase cells from glucose to galactose medium for 24-48h at 20°C.
- Split the culture into two aliquots (~1e7 cells each).
- Total Expression (Permeabilized): Pellet one aliquot. Resuspend in PBS/BSA containing primary antibody and 25 µg/mL Zymolyase. Incubate 1h at 30°C. Wash and label with secondary antibody. This stains intracellular + surface enzyme.
- Surface Display Only (Intact): Pellet the second aliquot. Resuspend in PBS/BSA containing primary antibody (no Zymolyase). Incubate on ice for 1h. Wash and label with secondary antibody on ice. This stains only surface-exposed enzyme.
- Analyze both samples by flow cytometry. Compare median fluorescence intensity (MFI).
- Calculate Secretion Efficiency: (MFISurface / MFITotal) x 100%. Values below 50% indicate significant secretion/processing bottlenecks.
- To troubleshoot, consider: (a) optimizing secretion signal (e.g., α-factor pre-pro sequence length), (b) lowering induction temperature to 18°C, (c) co-expressing chaperones (e.g., PDI1), or (d) using a protease-deficient strain (e.g, pep4Δ).
Protocol 3: FACS Gating Strategy for Enriching High-Efficiency Displayers
Objective: To sort a population of cells that not only have high enzymatic activity but also display the enzyme efficiently, ensuring sorted clones are genetically stable and suitable for subsequent sorting rounds.
Method:
- Dual-Labeling: Label the induced library with two distinct fluorescent probes:
- Activity Probe: A fluorescently quenched substrate or mechanism-based inhibitor (e.g., Green: 488 nm ex / 530 nm em).
- Display Probe: An antibody or ligand against an epitope tag on the surface anchor (e.g., Red: 640 nm ex / 670 nm em).
- Flow Cytometry Setup: Use a high-throughput sorter equipped with 488 nm and 640 nm lasers.
- Gating Hierarchy:
- Gate P1: On FSC-A vs. SSC-A to select single, healthy cells.
- Gate P2: On FSC-H vs. FSC-W to exclude doublets.
- Gate P3: On the Red (Display) fluorescence channel. Set a threshold to exclude cells with display levels below the autofluorescence of negative controls (cells with empty display vector). This selects for "Good Displayers."
- Gate P4: On the Green (Activity) fluorescence channel from the P3-gated population. Set a sort window to collect the top 0.1-5% of cells based on activity signal.
- Sort the P4 population into recovery medium. This population is enriched for variants that are both well-displayed and highly active.
Diagrams
Title: Enzyme Display Pipeline & Bottlenecks
Title: FACS Gating for Display & Activity
The Scientist's Toolkit
| Reagent/Material | Function in Addressing Display Challenges |
|---|---|
| pBAD/Myc-His Vectors | Provides tightly regulated, titratable arabinose-inducible promoter to mitigate expression toxicity in E. coli. |
| SRP-Adapted Sec Signal Peptides | Engineered signals (e.g., DsbA-SRP) that route proteins more efficiently to the Sec translocon, improving secretion yield. |
| Chaperone Co-expression Plasmids | Vectors expressing GroEL/ES, DnaK/J, or PDI to assist folding in the periplasm/ER, reducing aggregation and degradation. |
| Protease-Deficient Strains | Hosts like E. coli BL21(DE3) ΔompT ΔdegP or S. cerevisiae pep4Δ to minimize displayed enzyme degradation. |
| Fluorescent Activity-Based Probes (ABPs) | Quenched substrates or covalent inhibitors that become fluorescent upon enzyme reaction, enabling FACS detection of activity. |
| Anti-Epitope Tag Nanobodies (FITC) | Small, high-affinity binders for tags (e.g., HA, Myc, V5) conjugated to bright fluorophores for robust display quantification. |
| Cell Wall Digestion Enzymes (Zymolyase) | Allows immunostaining of intracellular retained enzyme to quantify secretion/display efficiency. |
| Anchoring System Toolkits (e.g., pCTCON2 for yeast) | Modular vectors with standardized linkers and epitope tags for rapid swapping of enzymes and display anchors. |
In the directed evolution of enzymes using FACS-based sorting, the intracellular environment presents unique bottlenecks. The broader thesis posits that successful sorting for improved enzymatic activity in vivo requires assay designs that explicitly account for and overcome three core constraints: Substrate Permeability, Cofactor Limitations, and Intracellular Reaction Kinetics. Failure to address these leads to the selection of false positives (e.g., improved transporters rather than enzymes) or the oversight of genuinely improved variants. This document provides application notes and protocols to hack these constraints, ensuring FACS gates correlate directly with the target enzyme's catalytic parameters.
Table 1: Common Substrate Permeability Hacks & Efficacy
| Substrate Type | Permeability Hack | Typical Efficiency Gain (Fold) | Key Measurement Method | Reference (2023-2024) |
|---|---|---|---|---|
| Polar/Charged Molecule | Esterification (Acetoxymethyl esters, AM) | 10-100x (intracellular conc.) | LC-MS of cell lysates | Smith et al., Nat. Protoc., 2023 |
| Large Molecules (e.g., peptides) | CPP-fusion (TAT, Penetratin) | 5-50x (uptake rate) | Flow cytometry (fluorescent tag) | Zhao & Liu, Cell Chem. Biol., 2024 |
| Non-Polar (Membrane-trapped) | Cyclodextrin-based delivery | 3-20x (aqueous phase conc.) | FRET-based solubility assay | BioCytoGen, Application Note 117 |
Table 2: Strategies to Bypass Cofactor Limitations
| Cofactor | Limitation | Hack | Impact on Apparent kcat/Km | Assay Compatibility |
|---|---|---|---|---|
| NAD(P)H | Regeneration, Cost | Phosphite dehydrogenase (PTDH) co-expression | Up to 100x rate sustained | Continuous in-cell coupled assay |
| ATP | Turnover, Decay | CK/PEP system with non-hydrolyzable analogs | Sustains >1mM [ATP] for hours | Luminescence (Luciferase-based) |
| Metal Ions (Mg2+, Zn2+) | Chelation, Toxicity | Apo-enzyme expression + controlled bolus addition | Restores 90-95% activity | FACS with metal-sensitive fluorophore |
Table 3: Kinetic Parameters Accessible via FACS-Compatible Assays
| Assay Principle | Measured Parameter | Dynamic Range | Temporal Resolution | Compatible with FACS? |
|---|---|---|---|---|
| FRET Substrate Cleavage | kcat/Km (specificity constant) | 10^2-10^5 M⁻¹s⁻¹ | Seconds to minutes | Yes (snapshot) |
| Fluorogenic Product Accumulation | Initial Rate (v0) | 0.1-1000 nM/s | Minutes to hours | Yes (endpoint) |
| Transcriptional Reporter (Biosensor) | Effective in vivo activity | 4-5 orders of magnitude | Hours | Yes (enrichment) |
Experimental Protocols
Protocol 1: Evaluating & Engineering Substrate Permeability for FACS
Aim: To distinguish between improved enzyme activity and improved substrate uptake in a directed evolution library. Materials: Library cells, membrane-impermeant fluorescent substrate, membrane-permeant pro-substrate (e.g., AM ester), control substrate (freely diffusible dye), FACS buffer (PBS++, 1% BSA). Procedure:
- Split Assay: Divide the library cell population into three aliquots.
- Staining:
- Tube A (Test): Incubate with the membrane-permeant pro-substrate (e.g., 10 µM, 30 min, 37°C).
- Tube B (Control for Uptake): Incubate with the membrane-impermeant version of the direct fluorescent product. This identifies cells with altered membrane permeability/efflux.
- Tube C (Loading Control): Incubate with a cell-permeant, chemically distinct control dye (e.g., Calcein Green) to normalize for general staining variability.
- Analysis & Gating: Analyze by flow cytometry.
- Gate first on viable cells (FSC/SSC).
- Plot Control Dye (C) vs. Test Signal (A). High A with normal C suggests enzyme activity.
- Plot Uptake Control (B) vs. Test Signal (A). High correlation suggests selection is for uptake, not catalysis.
- Sorting Strategy: Sort from the population that is high in (A) but low/normal in (B).
Protocol 2: Implementing a Cofactor Regeneration System forIn-CellCoupled Assays
Aim: To sustain cofactor levels for continuous enzyme activity measurement, preventing depletion from masking improved variants. Materials: Engineered cells co-expressing the target enzyme (E) and a cofactor-regenerating enzyme (Regen, e.g., PTDH for NADPH), substrate for E, substrate for Regen (e.g., phosphite), FACS-compatible reporter (e.g., fluorescent product from E's reaction). Procedure:
- Strain Construction: Use a bicistronic vector or dual plasmids to ensure co-expression of E and Regen in the library.
- Assay Medium Preparation: Prepare assay buffer containing:
- Primary substrate for target enzyme (at ~Km concentration).
- Excess, non-limiting substrate for the regenerating enzyme (e.g., 20 mM sodium phosphite).
- Any required cofactor at catalytic (not stoichiometric) levels (e.g., 50 µM NADP+).
- Incubation & Sorting: Incubate the cell library in the assay medium for a precisely timed window (e.g., 20-60 mins). Quench reaction if necessary (e.g., on ice). Sort directly based on the fluorescence intensity of the product.
Protocol 3: Kinetic Fingerprinting via Multi-Timepoint FACS Staining
Aim: To approximate intracellular enzyme kinetics (v0) and avoid endpoint saturation artifacts. Materials: Library cells, fluorogenic substrate, quencher solution (e.g., 10 mM EDTA/NaN3 in cold PBS), multi-well plate for timed staining. Procedure:
- Time-Course Setup: Aliquot identical cell samples into 5 tubes. Pre-warm all.
- Initiate Reaction: Add substrate simultaneously to all tubes, starting a timer.
- Quench: At staggered timepoints (e.g., t=0, 2, 5, 10, 20 min), add a large volume of ice-cold quencher buffer to stop the reaction.
- Measure: Keep all samples on ice, then analyze fluorescence for all on the flow cytometer under identical settings.
- Data Analysis: For each cell's lineage (post-sort analysis), plot fluorescence vs. time. The initial slope approximates v0. Use this to set intelligent gates for subsequent sorts, prioritizing cells with the highest initial rate, not just highest final signal.
Diagrams
The Scientist's Toolkit: Research Reagent Solutions
Table 4: Essential Reagents for Intracellular Enzyme Assay Development
| Reagent / Material | Function in Assay Development | Example Product/Catalog | Key Consideration |
|---|---|---|---|
| Acetoxymethyl (AM) Ester Kits | Converts polar, impermeant dyes/substrates into cell-permeant pro-forms. | Invitrogen Live-or-Dye kits; Abcam ab146265. | Esterase activity varies by cell type; requires optimization. |
| Cell-Penetrating Peptides (CPPs) | Chemically fused to substrates to enable uptake via endocytosis/direct penetration. | TAT (GRKKRRQRRRPQ), Penetratin conjugates. | Can cause cellular toxicity; control for non-specific effects. |
| Cofactor Regeneration Enzyme Kits | Sustain cofactor pools for continuous in-cell assays (NAD(P)H, ATP). | Sigma-Aldroth NADP+ Regeneration System; Promega ATPase/GTPase assay. | Must ensure regenerating enzyme is orthogonal and non-interfering. |
| Environment-Sensitive Fluorophores (SNARF, BCECF) | Report intracellular pH/metal ion changes as a proxy for activity. | Thermo Fisher SNARF-1; BCECF, AM. | Requires rigorous calibration within the specific cell type. |
| Fluorogenic Substrate Libraries | Broad-spectrum libraries to find optimal substrate for evolving enzyme. | EnzChek (Thermo Fisher); Fluor-de-Lys (BioVision). | Screen for low background and high dynamic range. |
| Quencher Solutions for Timed FACS | Rapidly stop enzymatic reactions at defined timepoints for kinetic FACS. | Custom: 20mM EDTA, 0.1% NaN3 in PBS, 4°C. | Must be compatible with cell viability for sorting. |
| Biosensor Plasmids | Transcriptional reporters that amplify enzyme activity into GFP signal. | Addgene: pGR, pCRE, pSRE reporter vectors. | Response can be slow (hours); not for real-time kinetics. |
| Microfluidic FACS Chips | Allow very rapid kinetic measurements and sorting based on real-time flux. | Cell Sorting Chip (Cytena); On-chip incubation. | Specialized equipment required; lower throughput than standard FACS. |
Instrument Calibration and Cytometer Settings for Optimal Resolution and Cell Viability
1. Introduction Within a thesis on Fluorescence-Activated Cell Sorting (FACS) for enzyme directed evolution, optimal cytometer performance is non-negotiable. High-resolution separation of enzyme-variant libraries based on fluorescent product or substrate conversion depends on precise instrument calibration and settings that preserve cell viability. This protocol details the steps for daily startup, calibration, and configuration to achieve optimal resolution while maintaining >90% post-sort viability for downstream recovery and analysis.
2. Key Research Reagent Solutions
| Reagent / Material | Function in FACS for Enzyme Evolution |
|---|---|
| UltraComp eBeads / Rainbow Calibration Particles | Multiplexed beads for instrument performance tracking (CVs, PMT voltages) and fluorescence compensation. |
| Viability Dye (e.g., Propidium Iodide, DAPI, SYTOX Blue) | Distinguishes live/dead cells; critical for gating viable populations for sorting. |
| Sheath Fluid (PBS-based, 0.22µm filtered) | Particle-free fluid for hydrodynamic focusing. For sensitive cells, Ca2+/Mg2+-free PBS or specific media is used. |
| Sort Collection Media (e.g., Recovery Media + 50% FBS) | High-protein, possibly antibiotic-containing media to support cell recovery post-sort. |
| Enzyme Substrate (Fluorogenic) | Cell-permeant probe cleaved by evolved enzyme to generate intracellular fluorescent signal, the basis for sort gating. |
| Cloning / Recovery Media | Rich media for outgrowth of sorted single cells or populations. |
| Nozzle Cleaner (e.g., 10% Bleach, 70% Ethanol) | For decontamination and removal of biohazardous material from fluidics. |
3. Instrument Calibration & Setup Protocol Objective: To standardize cytometer optical and fluidic systems for reproducible, high-resolution data acquisition.
3.1. Daily Startup & Fluidics Prime
- Power on cytometer, computer, and fluidics station.
- Depressurize system if needed. Fill sheath tank with filtered sheath fluid.
- Place a tube of 10% bleach in the sample port. Prime the fluidic system on "High" for 5 minutes.
- Replace with deionized water or sheath fluid and prime for 5 minutes.
- Install appropriate nozzle (e.g., 100µm for most mammalian cells, 70µm for bacteria).
3.2. Optical Alignment & Detector Setup Using Beads
- Run uniform silica beads (e.g., 1µm AlignFlow) to check and optimize laser alignment via side scatter (SSC) peak.
- Run UltraComp eBeads to set PMT voltages.
- Record target values for median fluorescence intensity (MFI) of each bead population in all detectors.
- Adjust PMT voltages so that bead peaks fall within consistent, log-spaced channels on a 4-decade scale (see Table 1).
- Calculate and record Coefficient of Variation (CV) for the brightest bead peak in the primary detection channel (e.g., FITC). Target CV < 3%.
Table 1: Target PMT Voltage Ranges for Common Fluorophores in Enzyme Evolution
| Fluorophore | Laser (nm) | Target MFI (Channel, 0-262K) | Suggested Starting PMT (V) | Acceptable CV |
|---|---|---|---|---|
| FITC / GFP | 488 | 45,000 - 55,000 | 450 | < 3% |
| PE | 488 | 40,000 - 50,000 | 500 | < 4% |
| mCherry | 561 | 40,000 - 50,000 | 550 | < 4% |
| Pacific Blue | 405 | 35,000 - 45,000 | 400 | < 5% |
| PerCP-Cy5.5 | 488 | 30,000 - 40,000 | 550 | < 5% |
3.3. Fluorescence Compensation Setup
- Prepare single-color controls: Cells or beads stained with each fluorophore used in the enzyme evolution screen (e.g., GFP signal from reaction, viability dye).
- Acquire each control individually using the voltages set in 3.2.
- Use cytometer software to generate a compensation matrix automatically. Verify by checking that the median fluorescence of each single-color control is equal in its primary and spillover channels.
- Save this application setting.
4. Protocol for Configuring High-Viability Sorting Parameters Objective: To sort enzyme-expressing cells with high purity while maintaining viability for culture expansion.
4.1. Pre-Sort Sample Preparation
- Harvest cells expressing enzyme variant library. Induce expression if necessary.
- Load with fluorogenic enzyme substrate at optimal concentration (determined empirically) for 30-60 min at relevant temperature.
- Add viability dye (e.g., 1 µg/mL Propidium Iodide) 5 minutes before analysis.
- Resuspend cells in sterile, filtered sort buffer (e.g., PBS + 1% FBS, 25mM HEPES) at a concentration of 5-10 x 10^6 cells/mL. Keep on ice.
4.2. Cytometer Settings for Viability
- Nozzle & Shear Stress: Use the largest nozzle appropriate for your cell size (100µm for 10-20µm cells). Keep sheath pressure low (20-25 psi for 100µm nozzle).
- Sample Temperature: Maintain at 4°C using a sample cooler.
- Drop Delay Calibration: Perform daily using Accudrop or similar beads. Ensure drop delay is precisely set for stable droplet breakoff and side streams.
- Sorting Mode: Purity (single-cell) or Yield (enrichment) mode based on downstream need. For clone recovery, use "Single Cell" or "Purity" mode.
- Collection Tube: Use tubes pre-filled with 500µL of recovery media. Keep collection tubes on ice or in a chilled block.
4.3. Gating Strategy for High-Resolution Sorting
- Create a standard gating workflow (see Diagram 1).
- Sort Gate Logic: Define the target population as Live (Viability Dye-negative), Single Cells, High Enzyme-Activity (Fluorescence+).
- Set sort gates conservatively to avoid ambiguous cells and ensure purity.
5. Post-Sort Validation Protocol
- Purity Check: Re-analyze a fraction of the sorted sample immediately. Target purity >95%.
- Viability Assessment:
- Mix 10µL of sorted cells with 10µL of Trypan Blue.
- Count live/dead cells on a hemocytometer.
- Calculate viability:
(Live cells / Total cells) * 100. Target >90%.
- Recovery & Outgrowth: Plate sorted cells immediately into appropriate growth media and monitor.
Diagrams
FACS Gating Strategy for Enzyme Evolution
High-Viability FACS Workflow
In FACS-based enzyme directed evolution, false positives from autofluorescent cells or passive protein binders consume sorting capacity and obscure genuinely improved enzyme variants. This application note details integrated protocols to identify and eliminate these artifacts, ensuring the selection pool is enriched for true catalytic function.
Quantifying and Characterizing Interference
A systematic assessment of background signal is prerequisite to any correction strategy.
Table 1: Common Sources of False Positives in FACS Sorting for Enzyme Evolution
| Source | Typical Cause | Primary Fluorescence Channels Affected | Impact on Sort |
|---|---|---|---|
| Cellular Autofluorescence | NAD(P)H, flavins, lipofuscins | Violet (405-410 nm), Blue (488 nm) | High background, mimics substrate turnover signal. |
| "Sticky" Passive Binders | Non-catalytic, hydrophobic, or charged protein variants binding substrate/fluorophore. | All, depending on conjugated fluorophore. | Masks as high-activity clones; depletes diversity. |
| Extracellular Matrix/ Debris | Secreted polysaccharides or cell wall fragments binding probes. | Variable, often broad spectrum. | Gate contamination, reduced purity. |
| Dead/Damaged Cells | Compromised membranes allowing passive dye influx. | All, non-specific. | Non-reproducible, non-heritable signal. |
Protocol 1.1: Baseline Autofluorescence Measurement Objective: Establish cell-only and expression-vector-only fluorescence baselines. Materials: Host cells (e.g., E. coli BL21, yeast, mammalian cells), empty expression vector, growth & induction media, flow cytometer.
- Transform host with empty vector. Prepare parallel culture of untransformed host.
- Grow cultures to standard expression OD. Induce following standard protocol.
- Harvest cells, wash 2x in PBS or assay buffer. Resuspend at ~1e6 cells/mL.
- Analyze on flow cytometer using identical laser and filter settings planned for the enzyme activity assay. Do not add any fluorescent substrate.
- Record median fluorescence intensity (MFI) and % of population exceeding a preliminary threshold for each relevant channel (e.g., FITC, PE). Use these values to set initial negative gates.
Strategies to Minimize Autofluorescence
Protocol 2.1: Metabolic Quenching for Reduced Autofluorescence Objective: Shift cell metabolism to reduce flavin and NAD(P)H pools pre-sort.
- Post-induction, pellet cells and resuspend in a quenching buffer: PBS supplemented with 10 mM potassium cyanide (KCN) and 10 mM sodium azide (NaN3). CAUTION: Use in fume hood, follow chemical safety protocols.
- Incubate for 30 minutes at 4°C in the dark. This inhibits respiratory electron transport, oxidizing autofluorescent cofactors.
- Wash cells 2x with ice-cold assay buffer to remove quenching agents before adding fluorescent substrate. Note: Viability is sacrificed; ensure sorted cells are for plasmid recovery, not regrowth.
Protocol 2.2: Optical Gating and Spectral Unmixing Objective: Use fluorescent properties to distinguish signal from background.
- Spectral Overlap Assessment: Run singly stained controls (autofluorescence only, single fluorophore) to create a spectral overlap matrix.
- Instrument Setup: If available, use a cytometer with high spectral resolution. Apply linear unmixing algorithms (in software) to mathematically separate the enzyme product signal from the autofluorescence spectrum.
- Alternative - Dual-Laser Gating: Choose a substrate fluorophore excited optimally by a laser line distant from autofluorescence peaks (e.g., use PE-Texas Red [561 nm ex] over FITC [488 nm ex] if autofluorescence is high in green). Create a scatter plot of Signal Channel vs. Autofluorescence Channel (e.g., 488 nm ex / 530 nm vs 405 nm ex / 450 nm). Gate on population bright in signal channel but low in autofluorescence channel.
Diagram Title: Optical Gating Strategy to Exclude Autofluorescent Cells
Strategies to Eliminate Passive Binders
Passive binders constitute a major false positive class in binding or turnover assays.
Protocol 3.1: Pre-Sort Competitive Elution with Non-Fluorescent Analog Objective: Displace passively bound fluorescent substrate through competition.
- Design: Synthesize or procure a high-concentration, non-fluorescent analog of the substrate (e.g., unlabeled sugar for glycosidase evolution, unmodified peptide for protease evolution).
- Procedure: After incubation of the cell library with the fluorescent substrate under standard assay conditions, pellet cells.
- Resuspend cell pellet in a large volume (e.g., 10x original assay volume) of wash/elution buffer containing a high concentration (e.g., 10-100x Km) of the non-fluorescent competitor.
- Incubate with gentle agitation for 15-30 minutes at assay temperature or 4°C.
- Pellet cells and wash 2x with standard assay buffer before FACS analysis. This step drastically reduces signal from equilibrium binders.
Protocol 3.2: Kinetic Gating via Time-Course Analysis Objective: Distinguish rapid catalytic turnover from slow, passive binding. Principle: True enzymes will generate a fluorescent product linearly over time initially. Passive binding will reach a rapid equilibrium.
- Setup: Split the induced library into two aliquots.
- Time-Staggered Labeling: Add fluorescent substrate to Aliquot A at time T=0. Add substrate to Aliquot B at a later time (e.g., T=10 min). Keep all other conditions identical.
- Stop Reaction: At a common endpoint (e.g., T=20 min), immediately quench both aliquots on ice and wash with cold buffer.
- Analysis: Analyze both aliquots by FACS. Gate on cells that are significantly brighter in Aliquot A (longer substrate exposure) compared to Aliquot B. This selects for variants where signal accumulates over time (catalysis) versus those with similar signal in both (rapid equilibrium binding).
Diagram Title: Kinetic Gating Workflow to Exclude Passive Binders
Table 2: Comparison of False Positive Control Strategies
| Strategy | Primary Target | Key Advantage | Potential Drawback | Best Applied When |
|---|---|---|---|---|
| Metabolic Quenching | Autofluorescence | Rapid, effective reduction of background. | Loss of cell viability. | Sorting for DNA recovery; very high autofluorescence. |
| Optical/Spectral Gating | Autofluorescence | Non-destructive; leverages instrument capability. | Requires appropriate lasers/filters; may lose dim positives. | Standard in most sorts; baseline correction. |
| Competitive Elution | Passive Binders | Highly effective for equilibrium binders. | Requires non-fluorescent competitor; may elute weak catalysts. | Substrate is costly or modified; binding is dominant issue. |
| Kinetic Gating | Passive Binders | Directly selects for kinetic trait of catalysis. | Requires precise timing; more complex workflow. | Turnover rate is key evolution target. |
The Scientist's Toolkit: Essential Reagents & Materials
Table 3: Research Reagent Solutions for False Positive Control
| Item | Function & Rationale | Example Product/Catalog Number (Check for latest) |
|---|---|---|
| Metabolic Inhibitors | Quench cellular respiration to oxidize NAD(P)H/flavins, reducing autofluorescence. | Sodium Azide (S2002, Sigma), Potassium Cyanide (60178, Sigma) - USE WITH EXTREME CAUTION. |
| Non-Fluorescent Competitive Substrate | High-concentration analog to displace passively bound fluorescent probe. | Custom synthesis from peptide/specialty providers (e.g., GenScript, AAPPTec) or unlabeled small molecules (e.g., Sigma Aldrich). |
| Protease/Phosphatase Inhibitor Cocktails | Prevent degradation of enzyme or substrate during assay, reducing heterogeneous background. | cOmplete EDTA-free (5056489001, Roche) or Halt (78430, Thermo). |
| BSA or Carrier Proteins | Add to wash/assay buffers to block non-specific binding to cells or surfaces. | Molecular Biology Grade BSA (AM2616, Thermo). |
| Viability Dyes (Non-Fluorescent Overlap) | Identify and gate out dead cells with compromised membranes. | Propidium Iodide (P3566, Thermo) - use with channel not used for activity assay. |
| Ultra-Pure Substrate Formulations | Minimize fluorescent impurities that cause non-specific staining. | HPLC-purified fluorogenic substrates (e.g., from Enzo Life Sciences, Tocris). |
| Strain-Specific Autofluorescence Control | Cells transformed with empty vector for baseline setting. | Prepared in-house from your host/vector system. |
Integrated Recommended Workflow
For a robust sort, combine multiple strategies:
- Pre-Sort: Express library, apply metabolic quenching (if viability not needed).
- Labeling: Incubate with ultra-pure fluorescent substrate under kinetic conditions.
- Elution: Perform competitive elution with non-fluorescent analog.
- Analysis: Run on cytometer using dual-laser optical gating (Signal vs. Autofluorescence channel) and/or kinetic gating logic. Include viability dye in a separate channel.
- Gate: Set conservative sort gates focusing on the population that passes all negative selection criteria (low autofluorescence, low viability dye, kinetic profile).
Benchmarking FACS: Performance Metrics, Comparative Analysis, and Case Studies in Biocatalysis
Application Notes
In FACS-based enzyme directed evolution, quantitative metrics are essential for evaluating screening efficiency, library quality, and campaign progress. These metrics move beyond simple hit identification to provide a rigorous, data-driven framework for iterative optimization.
1. Enrichment Factor (EF): This is the primary metric for assessing the selectivity and efficiency of a FACS screen. It measures the fold-increase in the frequency of desired variants in the sorted population relative to the pre-sorted library. A high EF indicates successful discrimination between active and inactive variants by the fluorescent assay. EFs are typically calculated for the top fraction of the sorted population (e.g., EF₁% or EF₀.₁%).
2. Library Coverage: This metric ensures statistical confidence in screening. It represents the ratio of the number of screened cells to the total diversity of the library. A coverage of 10x (10 cells screened per unique library variant) is often targeted to achieve >99.9% probability of sampling each variant at least once, minimizing the risk of missing valuable hits.
3. Functional Hit Rate (FHR): Post-sort validation is critical. The FHR is the percentage of sorted clones that, upon re-testing in a secondary assay (e.g., a microplate-based activity assay), confirm the desired phenotype. A low FHR suggests high false-positive rates from the FACS screen, often due to assay artifacts or non-specific fluorescence.
Summary of Key Quantitative Metrics
| Metric | Formula / Definition | Target Benchmark | Interpretation |
|---|---|---|---|
| Enrichment Factor (EF₁%) | (Hit%sorted / Hit%library) x 100 | >100 | High value indicates excellent screening stringency and assay dynamic range. |
| Library Coverage | # Cells Sorted / Library Diversity | ≥10x | Ensures statistically comprehensive screening of theoretical diversity. |
| Functional Hit Rate | (# Confirmed Hits / # Clones Tested) x 100 | >50% | Validates primary screen quality; low rates indicate high false positives. |
| Sorting Efficiency | (# Cells in Target Gate / # Total Events) x 100 | 0.1 - 5% | Balance between selectivity and practical sort duration. |
| Fold-Improvement in Activity | ActivityBestHit / ActivityWT | Campaign-dependent | Direct measure of evolutionary progress. |
Experimental Protocols
Protocol 1: Determining Enrichment Factor in a FACS Screen for Esterase Activity
Objective: To quantify the enrichment of active esterase variants using a fluorescein diacetate (FDA) substrate.
Materials:
- Library of esterase variants displayed on yeast surface (e.g., via Aga2p system).
- Fluorescein Diacetate (FDA) stock solution (10 mM in DMSO).
- SD-CAA and SG-CAA media for yeast induction.
- FACS buffer (PBS pH 7.4, 0.1% BSA, 1 mM EDTA).
- Flow cytometer equipped with a cell sorter (e.g., BD FACSAria, Sony SH800).
Procedure:
- Induction: Grow library to mid-log phase in SD-CAA. Induce expression by transferring cells to SG-CAA media. Incubate at 20°C for 18-24 hours.
- Assay Setup: Harvest 1x10⁷ induced cells by centrifugation. Wash twice with cold FACS buffer.
- Reaction: Resuspend cells in 1 mL FACS buffer containing 10 µM FDA. Incubate at room temperature for 10-15 minutes in the dark.
- Quenching & Analysis: Wash cells twice with ice-cold FACS buffer. Resuspend in 0.5 mL cold buffer. Keep on ice.
- Pre-Sort Analysis: Analyze 1x10⁵ cells on the flow cytometer. Gate on the live, expressing population. Record the percentage of cells (P_lib) falling within a pre-defined "active" gate (high fluorescein fluorescence, typically FL1 channel).
- Cell Sorting: Sort the top 0.5-1% of fluorescent cells into a collection tube containing growth medium.
- Post-Sort Analysis: Re-analyze a sample of the sorted cells (~10,000 events) under identical cytometer settings. Record the percentage of cells (P_sort) in the "active" gate.
- Calculation: Calculate EF₁% = (Psort / Plib) x 100.
Protocol 2: Validating Functional Hit Rate via Microplate Assay
Objective: To confirm the enzymatic activity of FACS-sorted clones in a bulk solution assay.
Materials:
- 96-well deep-well plates and clear flat-bottom 96-well assay plates.
- Lysis buffer (e.g., PBS with 1 mg/mL zymolyase for yeast).
- Substrate specific to enzyme target (e.g., p-nitrophenyl acetate for esterases).
- Plate reader capable of measuring appropriate absorbance/fluorescence.
Procedure:
- Clone Recovery & Growth: Plate sorted cells for single colonies. Pick 96 individual colonies into deep-well plates containing selective medium. Grow cultures to saturation.
- Protein Expression: Induce expression following the same protocol as the primary screen.
- Cell Harvest & Lysis: Pellet cells, wash, and resuspend in lysis buffer. Incubate with shaking to generate crude lysates.
- Secondary Assay:
- Transfer 50 µL of lysate supernatant to an assay plate.
- Initiate reaction by adding 150 µL of assay buffer containing the appropriate substrate at Km concentration.
- Immediately monitor product formation (e.g., absorbance at 405 nm for p-nitrophenol) for 5-10 minutes in a plate reader.
- Analysis: Calculate initial reaction velocities. Define a confirmed "hit" as a variant with activity >3 standard deviations above the background (vector-only control).
- Calculation: FHR = (Number of confirmed hits / 96) x 100.
Visualizations
Title: Workflow for Calculating Key FACS Metrics
Title: Decision Logic in Directed Evolution Using Metrics
The Scientist's Toolkit: Key Research Reagent Solutions
| Item | Function & Rationale |
|---|---|
| Fluorogenic Substrates (e.g., FDA, resorufin esters) | Cell-permeable, non-fluorescent probes hydrolyzed by active enzymes to yield a fluorescent product, enabling real-time activity measurement in live cells. |
| Yeast Surface Display System (e.g., pYD1 vector, Aga2p) | Provides a platform for coupling genotype (surface-displayed protein variant) to phenotype (fluorescent signal) for FACS-based sorting. |
| Anti-c-Myc & Anti-HA Antibodies (fluorescently conjugated) | Used to quantify surface expression levels of displayed variants, allowing normalization of activity to expression (critical for gate setting). |
| FACS Buffer (PBS-BSA-EDTA) | Preserves cell viability, reduces clumping, and minimizes non-specific binding during sort procedures. |
| Zymolyase / Lyticase | Enzymes for gentle lysis of yeast cell walls to generate crude lysates for secondary, plate-based validation assays. |
| Microplate-Based Assay Kits (e.g., p-nitrophenol, Amplex Red) | Provide robust, quantitative spectrophotometric/fluorometric readouts for high-throughput validation of hit clones. |
| Next-Generation Sequencing (NGS) Reagents | For deep sequencing of pre- and post-sort populations to analyze library diversity, track variants, and calculate EFs at the sequence level. |
Within the thesis framework of advancing Fluorescence-Activated Cell Sorting (FACS) for ultra-high-throughput enzyme directed evolution, it is critical to objectively evaluate its capabilities against other leading high-throughput screening (HTS) methodologies. This application note provides a detailed comparison of three core paradigms: FACS-based sorting, microfluidic droplet sorting, and microtiter plate (MTP) screening. The analysis focuses on throughput, sensitivity, cost, and applicability to enzyme evolution campaigns, culminating in detailed protocols for cross-platform validation.
Table 1: Head-to-Head Technical Specifications
| Parameter | FACS-Based Sorting | Microfluidic Droplet Sorting | Microtiter Plate Screening |
|---|---|---|---|
| Throughput (events/hour) | 50,000 - 100,000 cells/sec | 10,000 - 50,000 droplets/sec | 10^2 - 10^4 wells/hour |
| Library Size Practicality | 10^7 - 10^9 | 10^7 - 10^10 | 10^4 - 10^6 |
| Volume per Assay | Picoliters (cell-based) | Picoliters (1-10 pL droplets) | Microliters (50-200 µL) |
| Multiplexing Capacity | High (8+ parameters) | Moderate (Typically 1-3) | Low-Moderate (1-2) |
| Sorting Mode | Bulk (1D/2D gate) | Indexed, bulk, or selective | N/A (sequential assay) |
| Capital Cost | Very High ($250K-$500K+) | High ($150K-$300K) | Moderate ($50K-$150K) |
| Operational Cost per 10^6 | Moderate | Low | Very High |
| Key Advantage | Multiparametric, quantitative, high-purity recovery | Ultra-high-throughput, compartmentalization, low reagent use | Flexible assay chemistry, familiar workflow |
| Key Limitation | Requires cell-surface display or permeability; droplet contamination risk. | Assay must be droplet-compatible; complex microfluidics. | Low throughput; high reagent consumption. |
Table 2: Suitability for Enzyme Evolution Stages
| Evolution Stage | Primary Goal | Recommended Platform | Rationale |
|---|---|---|---|
| Diversification & Initial Screening | Interrogate vast diversity (10^7-10^9) | Microfluidic Droplet Sorting | Maximum throughput for finding initial hits from large libraries. |
| Stringent Sorting & Optimization | Fine discrimination based on multiple kinetic parameters (kcat/Km). | FACS-Based Sorting | Best for multiparametric analysis and high-purity recovery of improved variants. |
| Hit Validation & Characterization | Accurate kinetic measurements, specificity profiling. | Microtiter Plate Screening | Gold standard for quantitative biochemistry; necessary for final validation. |
Detailed Experimental Protocols
Protocol 1: FACS-Based Sorting for Enzyme Activity using a Fluorescent Substrate (e.g., β-Lactamase)
Objective: Isolate E. coli displaying enzyme variants with enhanced activity from a yeast surface display library. Key Reagents: See "Scientist's Toolkit" below.
- Induction: Induce enzyme display on yeast surface (e.g., in SG-CAA medium, 20°C, 36-48 hrs).
- Labeling: Wash cells 2x with PBSA (PBS + 0.5% BSA). Resuspend at ~10^7 cells/mL in PBSA.
- Substrate Incubation: Add fluorescent substrate (e.g., CCF2-AM for β-lactamase) at optimal concentration. Incubate in dark, 1-2 hrs, RT.
- Quenching & Preparation: Wash cells 2x with ice-cold PBSA. Resuspend in PBSA with propidium iodide (1 µg/mL) to label dead cells.
- FACS Sorting: Use a 100 µm nozzle. Gate on live (PI-negative), display-positive population. Set sort gate on the high-fluorescence tail (top 0.1-5%). Sort into recovery medium (e.g., SD-CAA with penicillin/streptomycin).
- Reculture & Analysis: Grow sorted population and repeat sorting for additional rounds. Plate for single colonies to isolate individual clones for MTP validation.
Protocol 2: Microfluidic Droplet Sorting for Phosphatase Activity
Objective: Screen a cell-free expressed library of phosphatase variants using a fluorogenic substrate.
- Droplet Generation:
- Prepare Aqueous Phase: Cell-free transcription/translation mix (PURExpress), DNA library (1-10 nM), fluorogenic substrate (e.g., 6,8-difluoro-4-methylumbelliferyl phosphate, DiFMUP).
- Prepare Oil Phase: HFE-7500 oil with 2% (w/w) fluorosurfactant.
- Flow aqueous and oil phases into a flow-focusing droplet generator chip at rates (e.g., 1000 µL/hr oil, 300 µL/hr aqueous) to generate ~5 µm diameter monodisperse droplets.
- Incubation: Collect droplets in a syringe. Incubate off-chip at 30°C for 2-4 hours for enzyme expression and reaction.
- Droplet Sorting:
- Re-inject droplets into a sorting chip (e.g., electrode-based deflection).
- Use a 488 nm laser for excitation and a 525/40 nm emission filter.
- Set a fluorescence threshold to trigger sorting of high-activity droplets (~1000 droplets/sec).
- Sorted droplets are collected into a tube containing 100 µL of breaking buffer (1H,1H,2H,2H-Perfluoro-1-octanol in HFE-7500).
- Recovery: Break the emulsion by pipetting. Recover the aqueous phase. Extract DNA via ethanol precipitation and transform into E. coli for amplification and sequencing.
Protocol 3: Microtiter Plate-Based Validation of Lipase Activity
Objective: Quantitatively characterize kinetic parameters of hits from FACS/droplet sorts.
- Culture & Lysis: Grow individual clones in 96-deep-well plates. Induce expression. Lyse cells via chemical (e.g., B-PER) or freeze-thaw.
- Assay Setup: In a clear-bottom 96-well or 384-well plate, add 80 µL of assay buffer (e.g., 100 mM Tris-HCl, pH 8.0). Add 10 µL of cell lysate. Initiate reaction by adding 10 µL of p-nitrophenyl ester substrate (e.g., pNP-butyrate) dissolved in DMSO/isopropanol.
- Kinetic Measurement: Immediately place plate in a plate reader pre-warmed to 30°C. Measure absorbance at 405 nm every 20 seconds for 10 minutes.
- Data Analysis: Calculate initial velocity (V0) from the linear slope. Normalize V0 to total protein concentration (Bradford assay). Determine relative activity and perform Michaelis-Menten analysis using varying substrate concentrations.
Visualization
Title: Directed Evolution Platform Integration Workflow
Title: FACS Gating Logic for Enzyme Display
The Scientist's Toolkit: Key Research Reagent Solutions
| Item | Function in Experiment | Example/Supplier |
|---|---|---|
| Fluorogenic Substrate (CCF2-AM) | Cell-permeable FRET-based substrate for β-lactamase. Enzyme cleavage shifts emission from green to blue. | Invitrogen, K1095 |
| Fluorosurfactant | Stabilizes aqueous-in-fluorocarbon oil droplets, preventing coalescence for droplet-based assays. | RAN Biotechnologies, 008-FluoroSurfactant |
| Cell-Free Protein Synthesis Kit | Enables in vitro expression of enzyme variants within droplets without cells. | New England Biolabs, PURExpress |
| pNP-Ester Substrates | Chromogenic substrates for hydrolytic enzymes (e.g., lipases, esterases). Releases p-nitrophenol (A405). | Sigma-Aldrich (e.g., pNP-butyrate, 91725) |
| Yeast Display Vectors | For surface display of enzyme libraries (e.g., pYD1). Contains Aga2p fusion for surface anchoring. | Thermo Fisher Scientific, V83501 |
| Propidium Iodide (PI) | Membrane-impermeant DNA stain. Used in FACS to exclude dead/damaged cells from analysis. | Sigma-Aldrich, P4170 |
| HFE-7500 Oil | Biocompatible, inert fluorinated oil used as the continuous phase in droplet microfluidics. | 3M Novec 7500 Engineered Fluid |
| Anti-c-Myc-FITC Antibody | Fluorescent conjugate for detecting surface-displayed enzymes fused to a c-Myc epitope tag. | Miltenyi Biotec, 130-116-485 |
| 96-Well Deep Well Plate | For high-density microbial culture during library expansion and protein expression pre-assay. | Corning, 3960 |
| Bradford Protein Assay Kit | For normalizing enzyme activity measurements to total protein concentration in lysates. | Bio-Rad, 5000006 |
Application Notes
Within FACS-based directed evolution, the primary cost-benefit analysis involves balancing throughput (events/second), equipment access (availability and cost of advanced sorters), and operational complexity (expertise, protocol development, and assay design). For enzyme evolution, the key is converting a desired enzymatic function (e.g., substrate turnover, stereoselectivity) into a quantifiable fluorescence signal that can be sorted at high speed.
Core Trade-offs:
- High-Throughput, Complex Access: Ultra-high-speed sorters (e.g., 100,000+ events/sec) maximize library coverage but are capital-intensive and often shared core facilities, limiting access and requiring significant scheduling foresight.
- Reduced Complexity, Limited Throughput: Benchtop analytical cytometers or plate-reader-based assays lower barriers to entry but drastically reduce sorting throughput, extending campaign timelines.
- Operational Burden: The complexity of designing a robust, specific, and sortable fluorescence assay often outweighs the physical sorting complexity. Multiparameter sorts to eliminate false positives add further operational layers.
Quantitative Comparison of Sorting Modalities:
Table 1: Comparative Analysis of FACS Modalities for Enzyme Evolution
| Modality | Typical Throughput (events/sec) | Relative Capital Cost | Access Model | Operational Complexity | Best for Enzyme Evolution Phase |
|---|---|---|---|---|---|
| Ultra-High-Speed Sorter | 70,000 - 100,000+ | Very High ($500K+) | Shared Core Facility | High (specialized training) | Primary screening of large (>10^8) naive libraries |
| Standard Jet-in-Air Sorter | 20,000 - 50,000 | High ($250-$400K) | Dedicated Lab or Core | Medium-High | General library screening & iterative evolution |
| Microfluidic/Chip-based Sorter | 1,000 - 10,000 | Medium ($50-$150K) | Dedicated Lab | Medium (integrated systems) | Smaller libraries, pathogen sorting, stringent conditions |
| FACS-on-a-Chip / Imaged-based | 100 - 1,000 | Low-Medium (<$100K) | Dedicated Benchtop | Low-Medium (assay development focus) | Proof-of-concept, small focused libraries, lab-on-a-chip integration |
Experimental Protocols
Protocol 1: Development of a Sortable Fluorescence Assay for Hydrolase Activity
Objective: To convert hydrolysis of a non-fluorescent substrate into a cell-surface fluorescence signal for FACS. Principle: Use a substrate coupled to a quencher via the enzymatically cleavable bond. Upon hydrolysis, the fluorophore is released and captured by a cell-surface antibody, labeling active clones.
Materials (Scientist's Toolkit): Table 2: Key Research Reagent Solutions
| Reagent/Material | Function & Explanation |
|---|---|
| Fluorogenic Substrate (e.g., DGGR, AFC/AMC derivatives) | Provides the enzymatic activity readout. Enzyme cleavage releases a fluorescent dye. |
| Cell-Specific Capture Antibody (Anti-Surface Protein, biotinylated) | Anchors the released fluorescent product specifically to the expressing cell. |
| Fluorophore-Conjugated Streptavidin (e.g., SA-APC) | Binds biotinylated capture antibody, providing the final, sortable signal. |
| FACS Buffer (PBS, 1% BSA, 1mM EDTA) | Maintains cell viability, prevents clumping, and reduces non-specific binding during sort. |
| Expression Host (e.g., E. coli or Yeast display system) | Genotype-phenotype linkage. Displays the enzyme variant on its surface. |
| 96-Well Deep Well Plates | For high-throughput cell culture and assay steps prior to sorting. |
Methodology:
- Library Expression: Induce enzyme variant expression in your display host (e.g., E. coli with autodisplay) under appropriate conditions (28°C, 16-24h).
- Cell Harvest & Wash: Harvest cells by centrifugation (4000xg, 5 min). Wash twice with assay-compatible buffer (e.g., 50mM Tris-HCl, pH 8.0).
- Primary Incubation with Substrate: Resuspend cell pellet at ~10^8 cells/mL in assay buffer containing 10-100µM fluorogenic substrate. Incubate with gentle rotation for 30-60 minutes at reaction temperature.
- Capture & Labeling: Without washing, add biotinylated capture antibody (1-5µg/mL final). Incubate 20 min on ice. Wash cells once to remove unbound antibody. Resuspend in FACS buffer containing fluorophore-conjugated Streptavidin (recommended dilution). Incubate 15 min on ice in the dark.
- Preparation for Sort: Wash cells twice with ice-cold FACS buffer. Resuspend in FACS buffer at ~5x10^6 cells/mL. Pass through a 35µm cell strainer.
- FACS Gating & Sorting: Use a non-substrate-treated control to set a background fluorescence gate. Sort the top 0.1-5% of fluorescent cells into recovery medium (e.g., SOC medium for E. coli). Maintain collection tubes on ice or at 4°C.
Protocol 2: Multiparameter Gating to Reduce False Positives
Objective: Implement a 3-parameter sort to isolate true enzyme positives from background, autofluorescent, or aggregating cells. Procedure:
- Stain Control Samples: Prepare single-color controls for each fluorophore used (e.g., FITC for substrate product, APC for capture label).
- Live/Dead Discrimination: Include a viability dye (e.g., propidium iodide, 1µg/mL) or use forward scatter (FSC-A) vs. side scatter (SSC-A) to exclude debris.
- Doublet Discrimination: Use FSC-H vs. FSC-W (or SSC-H vs. SSC-W) to exclude cell doublets/aggregates, ensuring single-cell sorts.
- Gating Hierarchy:
- Gate P1: FSC-A vs. SSC-A to select the main population of intact cells, excluding debris.
- Gate P2: FSC-H vs. FSC-W on P1 to select single cells.
- Gate P3: Fluorescence A (e.g., APC, emission ~660nm) vs. Fluorescence B (e.g., FITC, emission ~525nm) on P2. Draw a diagonal gate to select cells that are dual-positive, requiring correlation between the capture signal and the enzymatic product signal. This excludes cells with non-specifically bound fluorophore.
Visualizations
Title: Workflow for FACS-Based Enzyme Evolution Screening
Title: Key Trade-Offs in FACS-Based Evolution
Within the broader thesis framework focusing on FACS-based directed evolution of enzymes, this case study details the application of these methodologies to a critical problem in oncology drug development: optimizing the linker enzymes in Antibody-Drug Conjugates (ADCs). The ADC linker must remain stable in circulation but efficiently release its cytotoxic payload upon internalization into the target cancer cell. Enzymes, such as cathepsin B or β-glucuronidase, are often incorporated as part of the linker’s cleavage mechanism. Directed evolution, coupled with high-throughput screening via Fluorescence-Activated Cell Sorting (FACS), is employed to engineer these enzymes for enhanced catalytic efficiency, stability, and tumor-specific activity, thereby improving the therapeutic index of ADCs.
Table 1: Comparison of Key ADC Linker Enzyme Properties Before and After Directed Evolution
| Enzyme & Property | Wild-Type (Baseline) | Evolved Variant (Example) | Assay Method |
|---|---|---|---|
| Cathepsin B: kcat/KM (M⁻¹s⁻¹) | 2.1 x 10⁴ | 1.7 x 10⁵ | Fluorescent substrate hydrolysis |
| Cathepsin B: Plasma Stability (t1/2, h) | 48 | >120 | Incubation in human plasma |
| β-Glucuronidase: Activity at pH 5.0 (%) | 100 | 100 | Normalized activity |
| β-Glucuronidase: Activity at pH 7.4 (%) | 15 | <2 | Normalized activity (reduced off-target cleavage) |
| Sortase A: Ligation Efficiency (%) | 65 | 92 | Analytical HPLC |
| Sortase A: Expression Yield (mg/L) | 8 | 45 | Purification from E. coli |
Table 2: FACS Screening Parameters for ADC Linker Enzyme Evolution
| Parameter | Typical Setting/Range | Purpose |
|---|---|---|
| Sorting Gate | Top 0.5-2% fluorescent signal | Selects highest activity variants |
| Library Size Screened | 10⁷ - 10⁹ cells | Ensves coverage of diversity |
| Substrate | Cleavable fluorogenic probe (e.g., MMAE-linked quencher/fluorophore) | Mimics ADC linker, enables activity readout |
| Positive Control Signal (RFU) | 10,000 - 50,000 | Defined by wild-type enzyme display |
| Negative Control Signal (RFU) | 500 - 1,500 | Defined by empty-vector or inactive mutant display |
| Sorting Rounds | 3-5 | Iterative enrichment for improved variants |
Experimental Protocols
Protocol 3.1: FACS-Based Screening for Enhanced Cathepsin B Cleavage Activity
Objective: To isolate cathepsin B variants with improved cleavage kinetics for a valine-citrulline (Val-Cit) linker mimic.
- Library Construction: Generate a cathepsin B mutant library via error-prone PCR of the mature enzyme gene. Clone into a yeast surface display vector (e.g., pYD1) for expression as an Aga2p fusion.
- Induction & Display: Induce library expression in S. cerevisiae EBY100 with SG-CAA medium at 20°C for 48 hours.
- Substrate Labeling: Incubate 10⁸ yeast cells with 500 nM of a fluorogenic substrate: a peptide (Val-Cit) conjugated to a fluorescent dye (e.g., FITC) and a quenching agent. Use PBS buffer at pH 6.0 (mimicking early endosome) for 30 minutes at 37°C.
- FACS Staining & Sorting: Wash cells twice with ice-cold PBS. Resuspend in PBS + 1% BSA for sorting. Use a flow cytometer equipped with a 488 nm laser. Gate on cells displaying the enzyme (via anti-c-myc tag staining with a PE-conjugated antibody, 561 nm laser). Sort the top 1% of FITC-positive (530/30 nm filter) cells from this displayed population into recovery medium.
- Recovery & Amplification: Grow sorted cells in SD-CAA medium at 30°C for 48 hours. Re-induct and repeat sorting for 3-4 rounds, increasing stringency by reducing substrate concentration or incubation time.
- Clone Analysis: Isolate plasmid DNA from final sorted pool, transform into E. coli, sequence individual clones, and characterize purified enzyme kinetics.
Protocol 3.2: Assessing Plasma Stability of Evolved Linker Enzymes
Objective: To determine the stability of evolved enzymes in human plasma, predicting ADC circulation stability.
- Sample Preparation: Dilute purified wild-type and evolved enzyme to 1 µM in 50 µL of PBS.
- Plasma Incubation: Add 450 µL of freshly thawed, sterile-filtered human plasma to each sample. Mix gently. Incubate at 37°C.
- Time-Point Sampling: At t = 0, 24, 48, 72, 96, and 120 hours, withdraw 80 µL aliquots and immediately mix with 20 µL of 50 mM EDTA (pH 8.0) to inhibit further proteolytic activity.
- Activity Measurement: Dilute each quenched sample 1:5 in assay buffer (pH 5.0 for cathepsin). Add fluorogenic substrate and measure initial reaction velocity (RFU/min) in a plate reader.
- Data Analysis: Normalize activity relative to the t=0 time point for each enzyme. Plot % residual activity vs. time. Calculate the apparent half-life (t1/2) using an exponential decay fit.
Visualization Diagrams
Title: ADC Mechanism of Action with Enzymatic Linker Cleavage
Title: Workflow for FACS-Based Directed Evolution of ADC Enzymes
The Scientist's Toolkit: Research Reagent Solutions
Table 3: Essential Materials for ADC Linker Enzyme Engineering
| Item | Function in Research | Example Product/Catalog |
|---|---|---|
| Yeast Surface Display Vector | Display enzyme library on yeast cell surface for FACS screening. | pYD1 (Thermo Fisher) |
| Fluorogenic Cleavable Substrate | Mimics ADC linker; cleavage releases fluorescence for FACS readout. | Custom Val-Cit-PABC coupled to FITC/Dabcyl. |
| Anti-c-myc Tag Antibody (PE) | Fluorescently labels displayed enzymes to gate on expressing cells. | Anti-c-myc-PE (Miltenyi Biotec) |
| Human Plasma (Sterile) | For ex vivo stability testing of evolved enzyme variants. | Human Plasma K2EDTA (Sigma) |
| Cathepsin B Activity Assay Kit | Quantitative kinetic analysis of purified enzyme variants. | Cathepsin B Activity Fluorometric Kit (BioVision) |
| FACS Sorter | High-throughput isolation of cells expressing improved enzymes. | BD FACSAria III (BD Biosciences) |
| Error-Prone PCR Kit | Introduces random mutations to create the initial enzyme library. | GeneMorph II Random Mutagenesis Kit (Agilent) |
Directed evolution, particularly when coupled with fluorescence-activated cell sorting (FACS), provides a powerful high-throughput platform for engineering enzyme function. This application note details protocols for evolving two critical enzyme classes—nitrilases and cytochrome P450s (P450s)—for applications in sustainable chemical synthesis (green chemistry) and predictive drug metabolism. FACS enables the screening of vast mutant libraries (>10^8 variants) based on fluorescent reporters linked to desired enzymatic activities, accelerating the discovery of promiscuous and enhanced variants.
Application Notes
Nitrilases for Green Chemistry
Objective: Evolve nitrilase variants with broad substrate specificity for the synthesis of chiral carboxylic acids, key intermediates in pharmaceutical and agrochemical manufacturing. FACS Strategy: A coupled assay where enzymatic hydrolysis of a nitrile substrate releases a product that reacts with a probe (e.g., o-phthalaldehyde) to generate a fluorescent adduct inside E. coli cells. Key Outcomes: Improved activity towards bulky or non-natural nitrile substrates, enhanced enantioselectivity, and stability under industrial process conditions (e.g., high substrate concentration, elevated temperature).
P450s for Drug Metabolism
Objective: Engineer human or bacterial P450s to replicate human drug metabolism pathways for in vitro metabolite production and toxicity screening. FACS Strategy: Utilize substrate conversion-dependent fluorescent probes or complementation assays. For example, engineering P450 BM3 for dealkylation activity can be linked to conversion of a non-fluorescent coumarin ether to a fluorescent coumarin. Key Outcomes: P450 variants capable of producing human-relevant metabolite profiles (e.g., specific hydroxylations), with higher turnover numbers than human liver microsomes for scalable synthesis.
Table 1: Representative Evolution Outcomes for Nitrilases and P450s
| Enzyme Class | Target Activity | Evolution Rounds (Library Size) | Key Improved Parameter | Fold Improvement | Assay Method |
|---|---|---|---|---|---|
| Nitrilase (from P. fluorescens EBC191) | Hydrolysis of mandelonitrile | 4 (~5x10^8) | Specific Activity (bulky arylacetonitriles) | 45 | FACS (intracellular fluorescence) |
| Nitrilase (from Syechocystis sp.) | Enantioselectivity (R)-Mandelic acid | 3 (~2x10^8) | Enantiomeric Excess (ee) | from 20% to 95% | FACS + HPLC |
| P450 BM3 (CYP102A1) | Diclofenac 4'-hydroxylation | 5 (~10^9) | Total Turnover Number (TTN) | 1,200 | FACS (coumarin product) |
| P450 BM3 (CYP102A1) | Propoxycoumarin O-dealkylation | 3 (~3x10^8) | Catalytic Efficiency (kcat/Km) | 80 | FACS (direct fluorescence) |
| Chimeric Human P450 3A4 | Midazolam 1'-hydroxylation | 4 (~7x10^8) | Reaction Rate (nmol/nmol P450/min) | 15 | FACS + LC-MS (metabolite detection) |
Experimental Protocols
Protocol: FACS-Based Screening for Promiscuous Nitrilase Activity
Objective: To isolate nitrilase variants with enhanced activity on a target nitrile substrate from a saturated mutagenesis library.
Materials: See "Scientist's Toolkit" (Section 5).
Procedure:
- Library Construction: Perform error-prone PCR or site-saturation mutagenesis on the parent nitrilase gene. Clone into an appropriate expression vector (e.g., pET series) and transform into E. coli BL21(DE3).
- Expression & Assay: Grow deep-well plates overnight. Induce expression with IPTG (0.1 mM) for 16-18h at 25°C.
- Cell Permeabilization & Reaction: Harvest cells, wash, and resuspend in 50 mM Tris-HCl buffer (pH 7.5). Add permeabilization agent (e.g., 0.1% w/v CTAB) and the target nitrile substrate (5-10 mM).
- Fluorescent Product Formation: Incubate with shaking (30°C, 60 min). Add fluorescence development mix: 100 µM o-phthalaldehyde, 1 mM β-mercaptoethanol in borate buffer (pH 9.5). Incubate in dark (25°C, 15 min).
- FACS Sorting: Dilute cells in ice-cold sorting buffer (PBS). Use FACS to sort the top 0.5-1% most fluorescent cells into recovery media (e.g., LB with 1% glucose). Use a 488 nm laser for excitation and a 530/30 nm bandpass filter for detection.
- Recovery & Validation: Grow sorted cells, isolate plasmids, and retransform for validation in a microtiter plate fluorescence assay. Sequence hits and characterize kinetically.
Protocol: High-Throughput Evolution of P450s Using Fluorescent Substrate Analogs
Objective: To evolve P450 BM3 for enhanced dealkylation activity on a target ether substrate.
Materials: See "Scientist's Toolkit" (Section 5).
Procedure:
- Library Creation: Generate a mutant library targeting the heme domain of P450 BM3 using CASTing or SeSaM. Express in E. coli with a plasmid encoding a phosphite dehydrogenase (ptdh) for cofactor regeneration.
- Cultivation & Induction: Grow 96-deep-well plates at 30°C to mid-log phase. Induce with 0.5 mM IPTG and add 0.5 mM δ-aminolevulinic acid (heme precursor). Express for 24h at 25°C.
- Whole-Cell Assay: Centrifuge plates, wash cells, and resuspend in PBS containing 1 mM MgCl2. Add the non-fluorescent substrate (e.g., 7-benzyloxyquinoline) to a final concentration of 50 µM.
- Incubation & Sorting: Incubate plates at 30°C for 30-60 min with shaking. Quench reaction on ice. Sort cells directly based on the fluorescence of the dealkylated product (ex: 405 nm, em: 460 nm). Gate for the most fluorescent 0.2-1% of the population.
- Enrichment & Analysis: Perform 2-3 rounds of sorting with increasing stringency (shorter reaction times). Plate sorted pools for single colonies, re-test in a 96-well format, and sequence improved variants. Characterize purified enzymes for substrate scope and kinetics.
Visualization Diagrams
Diagram Title: FACS-Based Directed Evolution General Workflow
Diagram Title: Nitrilase Fluorescent Coupled Assay Pathway
Diagram Title: P450 Direct Fluorescent Substrate FACS Principle
The Scientist's Toolkit
Table 2: Essential Research Reagent Solutions for FACS-Based Enzyme Evolution
| Item | Function in Protocol | Example/Notes |
|---|---|---|
| Fluorogenic Substrates/Probes | Serve as direct or indirect reporters of enzymatic activity for FACS detection. | o-Phthalaldehyde (for amines), 7-Benzyloxyquinoline (for P450s), Fluorescein diacetate (esterase control). |
| Permeabilization Agents | Allow substrate and probe access to intracellular enzymes without complete lysis. | Cetyltrimethylammonium bromide (CTAB, 0.1%), Toluene/Ethanol (1:4), Polymyxin B. |
| Cofactor Regeneration System | Sustains activity of oxidoreductases (e.g., P450s) in whole-cell assays. | Plasmid-encoded PtDH/Phosphite; or glucose dehydrogenase (GDH)/glucose. |
| FACS Sorting Buffer | Maintains cell viability and prevents clumping during sorting. | Phosphate-buffered saline (PBS), pH 7.4, with 0.5-1% glucose or 0.01% Pluronic F-68. |
| Heme Precursor | Boosts functional P450 expression in E. coli. | δ-Aminolevulinic acid (ALA), typically added at 0.5 mM at induction. |
| Recovery Media | Supports outgrowth of fragile, sorted single cells. | Rich medium (e.g., SOC) supplemented with 1% glucose or 20 mM MgSO4. |
| Saturation Mutagenesis Kit | Creates focused mutant libraries at chosen residues. | NNK codon primers & high-fidelity PCR mix (e.g., from NEB or Thermo Fisher). |
| Flow Cytometer Calibration Beads | Ensures day-to-day consistency in FASC sensitivity and gating. | Fluorescent rainbow beads or alignment beads (e.g., from Spherotech or BD). |
Application Notes
The integration of Fluorescence-Activated Cell Sorting (FACS) with Next-Generation Sequencing (NGS), known as Sort-Seq, represents a transformative methodology within enzyme directed evolution. This approach enables the high-throughput mapping of genotype to phenotype, allowing for the empirical construction of fitness landscapes from complex mutant libraries. By quantitatively linking cellular fluorescence (a proxy for enzymatic activity) to variant sequence via deep sequencing, researchers can identify mutations that confer enhanced function, stability, or novel substrate specificity.
Key Advantages:
- High-Throughput Phenotyping: FACS can screen >10⁸ variants per day, orders of magnitude faster than conventional microplate assays.
- Quantitative Resolution: Multi-bin sorting based on fluorescence intensity provides continuous fitness data rather than simple yes/no enrichment.
- Deep Mutational Scanning (DMS): Enables systematic interrogation of all possible single or multiple mutations within a protein region to understand sequence-function relationships comprehensively.
- Fitness Landscape Navigation: Data from Sort-Seq experiments reveal epistatic interactions, evolutionary trajectories, and local fitness maxima, guiding rational design cycles.
Typical Quantitative Outcomes: Data from a Sort-Seq experiment for a hydrolytic enzyme are summarized below. Fitness scores are derived from the normalized enrichment/depletion of variants in high-activity sort gates versus the naive library.
Table 1: Exemplar Sort-Seq Data for a Model Hydrolase DMS
| Variant ID | Mutations | Mean Fluorescence (a.u.) | Sort Bin (Gate) | NGS Count (Input) | NGS Count (High-Activity Gate) | Computed Fitness Score (ε) |
|---|---|---|---|---|---|---|
| WT | None | 10,200 | Mid-High | 45,500 | 22,100 | 1.00 |
| Var_001 | A121V | 18,500 | High | 39,800 | 65,200 | 1.63 ± 0.08 |
| Var_002 | F205L | 2,100 | Low | 41,200 | 850 | 0.21 ± 0.02 |
| Var_003 | A121V/L189I | 22,700 | High | 38,500 | 72,100 | 1.87 ± 0.09 |
| Var_004 | D45G | 9,800 | Mid | 40,100 | 20,500 | 0.98 ± 0.05 |
| ... | ... | ... | ... | ... | ... | ... |
Table 2: Key Experimental Parameters for a Standard Sort-Seq Run
| Parameter | Typical Value or Specification | Notes |
|---|---|---|
| Library Size | 10⁸ - 10⁹ CFU/variants | Diversity limited by transformation efficiency. |
| FACS Gating | 4-6 bins based on fluorescence | Bins define fitness cohorts for NGS. |
| Cells Sorted per Bin | 0.5 - 2 x 10⁶ cells | Provides deep sequencing coverage. |
| Sequencing Depth (per bin) | >100x library diversity | Ensures statistical robustness. |
| Primary Readout | Enrichment Ratio (ε) | ε = log₂[(Countbin / Countinput) / (CountWTbin / CountWTinput)] |
Detailed Experimental Protocol
Protocol: Sort-Seq for Enzyme Fitness Landscape Mapping
I. Library Construction & Transformation
- Generate Mutant Library: Use error-prone PCR or oligonucleotide pool synthesis to create a diverse DNA library encoding your target enzyme.
- Clone into Expression Vector: Clone library into an appropriate intracellular or surface display vector (e.g., pET, yeast display plasmid) containing a selectable marker.
- Transform into Host Cells: Electroporate or chemically transform the library into the microbial host (e.g., E. coli BL21). Aim for a transformation yield >10⁷ colonies to ensure library coverage.
- Recovery and Expansion: Incubate transformed cells in rich medium (e.g., LB + antibiotic) for 1-2 hours, then amplify overnight culture. Harvest cells for induction.
II. Phenotypic Sorting via FACS
- Induction & Assay: Induce enzyme expression (e.g., with IPTG). For intracellular enzymes, use a fluorogenic substrate or a coupled assay that generates a fluorescent product. For displayed enzymes, label with a fluorescent substrate or inhibitor.
- Sample Preparation: Wash and resuspend cells in sort buffer (PBS + 0.5% BSA). Filter through a 35-μm cell strainer.
- FACS Instrument Setup: Calibrate using control cells (WT, inactive mutant, no-substrate control). Set thresholds to exclude debris and aggregates.
- Define Sort Gates: Based on the fluorescence distribution of the WT control, define 4-6 sorting gates (bins) spanning the range from low to high fluorescence (see Diagram 1).
- Sorting: Sort 0.5-2 million cells from each gate into separate collection tubes containing recovery medium. Also retain a sample of the pre-sort ("input") library.
- Pellet and Store: Pellet sorted cells, remove supernatant, and freeze pellets at -80°C for DNA extraction.
III. Genotype Recovery & Sequencing (Sort-Seq)
- Plasmid DNA Recovery: Extract plasmid DNA from the input library and each sorted cell pellet using a miniprep kit. Pool multiple preps if necessary.
- PCR Amplification of Variant Region: Amplify the mutagenized region using primers containing Illumina adapter sequences and unique dual-index barcodes for each sample (input and each bin).
- NGS Library Purification & Quantification: Purify PCR products with magnetic beads. Quantify using a fluorometric assay (e.g., Qubit). Pool equimolar amounts of each barcoded library.
- Sequencing: Perform paired-end sequencing on an Illumina MiSeq or HiSeq platform to achieve >100-fold coverage over the library diversity.
IV. Data Analysis & Fitness Calculation
- Sequence Processing: Demultiplex reads. Align to reference gene sequence. Call variants and count their frequency in the input and each bin.
- Fitness Score Calculation: For each variant i in bin j, compute the enrichment ratio:
ε_i = log₂( (f_ij / f_input_i) / (f_WT_j / f_WT_input) )wherefis the frequency. - Landscape Visualization: Use average ε values from relevant bins to assign a final fitness score. Plot fitness versus mutation position or use specialized software (e.g., dms_tools) to visualize landscapes and epistasis.
Visualizations
Title: Sort-Seq Workflow for Enzyme Fitness Landscapes
Title: Multi-Bin FACS Gating Strategy
The Scientist's Toolkit: Essential Research Reagents & Materials
Table 3: Key Reagent Solutions for FACS-NGS (Sort-Seq) Experiments
| Item | Function & Specification | Example Product/Category |
|---|---|---|
| Fluorogenic Substrate | Enzyme-specific probe that becomes fluorescent upon reaction. Must be cell-permeable if assaying intracellular activity. | 4-methylumbelliferyl (4-MU) derivatives, Fluorescein diacetate (FDA), custom coumarin-based substrates. |
| Live-Cell Sorting Buffer | Preserves cell viability and enzymatic activity during prolonged sorting. Typically isotonic with additives. | PBS (pH 7.4) + 0.5-1% BSA or FBS, + 1 mM substrate if required for continuous assay. |
| NGS Library Prep Kit | For efficient amplification and barcoding of variant sequences from recovered plasmid DNA. | Illumina Nextera XT, NEBNext Ultra II Q5 Master Mix. |
| Dual-Index Barcoded Primers | Unique molecular identifiers for multiplexing samples (input + multiple sort bins) in one sequencing run. | Illumina i7/i5 index primers, custom TruSeq-style primers. |
| Competent Cells (High-Efficiency) | Essential for achieving large, representative transformation libraries. | E. coli NEB 10-beta or similar (>10⁹ CFU/μg transformation efficiency). |
| Surface Display System | For enzymes not suitable for intracellular assay; links phenotype directly to cell surface. | Yeast display (pCTcon2 vector), bacterial display (Autotransporter, Ice Nucleation Protein fusions). |
| Data Analysis Software | For processing NGS counts and calculating fitness scores. | dms_tools (Python), Enrich2, custom R scripts. |
Conclusion
FACS-based screening represents a paradigm shift in directed evolution, offering unparalleled throughput and quantitative single-cell resolution that directly addresses the central challenge of functional library screening. This guide has synthesized the journey from foundational principles to advanced optimization and validation. By mastering the methodological workflow and troubleshooting common hurdles, researchers can reliably deploy FACS to interrogate vast sequence spaces, dramatically accelerating the discovery of enzymes with enhanced activity, stability, and novel functions. The comparative analysis confirms FACS as a versatile and powerful tool, particularly when integrated with next-generation sequencing for mechanistic insight. Looking forward, the convergence of FACS with advanced display technologies, machine learning-aided library design, and ultra-miniaturized sorting platforms promises to further democratize and potentiate enzyme engineering. For biomedical research, this translates directly into accelerated development of therapeutic enzymes, biocatalytic drug synthesis routes, and engineered proteins for diagnostic and cellular therapies, solidifying FACS as an indispensable engine for innovation in the life sciences.