Navigating the Exploration-Reliability Trade-Off: Modern Strategies for Protein Sequence Design in Drug Discovery
This article provides a comprehensive guide for researchers and drug development professionals on navigating the critical balance between exploring novel protein sequences and ensuring their functional reliability.
Navigating the Exploration-Reliability Trade-Off: Modern Strategies for Protein Sequence Design in Drug Discovery
Abstract
This article provides a comprehensive guide for researchers and drug development professionals on navigating the critical balance between exploring novel protein sequences and ensuring their functional reliability. We cover the fundamental concepts of this trade-off, detail cutting-edge computational and experimental methodologies, address common challenges in optimization, and provide frameworks for rigorous validation. By synthesizing insights from recent advances in deep learning, directed evolution, and physics-based modeling, this resource aims to equip scientists with practical strategies to design proteins that are both innovative and robust for therapeutic and industrial applications.
The Core Dilemma: Understanding the Exploration vs. Exploitation Trade-off in Protein Design
In protein sequence design, a fundamental tension exists between Exploration (discovering novel sequences with potentially revolutionary functions) and Reliability (ensuring stable, well-folded, and functional proteins). This technical support center provides troubleshooting guidance for common experimental failures encountered while navigating this spectrum, framed within the thesis that successful research requires strategic balancing of these two imperatives.
Troubleshooting Guides & FAQs
Section 1: Stability & Folding Issues
Q1: My designed novel protein expresses solubly but is prone to aggregation during purification. How can I improve its stability without completely abandoning the novel fold? A: This is a classic Exploration-Reliability conflict. The novel fold may have marginal stability.
- Troubleshooting Steps:
- Diagnose: Perform a thermal shift assay (see Protocol 1) to determine the melting temperature (Tm). Compare to a stable native protein control.
- Stabilize: Consider computational minimal stabilization. Use a tool like Rosetta
ddg_monomerto predict point mutations that improve folding energy. Introduce 1-3 top-predicted stabilizing mutations, prioritizing mutations that do not contact the putative active site to preserve novel function. - Purification: Add 10% (v/v) glycerol or 150-300 mM Arginine to the purification buffers to suppress transient aggregation. Use a more gradual imidazole gradient during IMAC purification.
Q2: My high-throughput screening of a novel sequence library shows zero functional hits. Did I explore useless sequence space? A: Not necessarily. The issue may lie in the reliability of your screening assay for exploratory sequences.
- Troubleshooting Steps:
- Control Check: Ensure your screening assay (e.g., yeast display, phage display) includes a known positive control protein that is correctly expressed and detected. A failed control indicates an assay reliability issue.
- Expression Check: Use a fluorescent tag (e.g., GFP fusion) or a conformation-sensitive antibody (like anti-6xHis Tag Antibody, Cat. #MA1-21315) in parallel to determine if your novel sequences are even expressed and folded on the display platform.
- Library Design: Your exploration may have been too broad. Consider a focused exploration strategy: start from a stable scaffold and introduce novelty in localized regions only.
Section 2: Functional Validation Issues
Q3: The computationally designed enzyme has excellent stability metrics but shows <5% of the catalytic activity of the natural counterpart. Why? A: You have over-optimized for reliability (stability) at the cost of functional dynamics, which are crucial for exploration of catalysis.
- Troubleshooting Steps:
- Analyze Dynamics: Run short molecular dynamics (MD) simulations (e.g., using GROMACS) to see if the active site residues are rigidly locked or have appropriate flexibility. Compare the B-factors (mobility) to the natural enzyme.
- Introduce Controlled Flexibility: Identify distal "control lever" residues that rigidify the active site. Mutate these to smaller/glycine residues to allow necessary backbone motion (see Protocol 2).
- Check Electrostatics: Use a Poisson-Boltzmann solver (e.g., APBS) to calculate the electrostatic potential of the active site. Misaligned fields can drastically reduce activity. Consider mutating surface residues to tune the potential.
Q4: My de novo designed protein binds the target in ITC/SPR but with very weak affinity (Kd > 100 µM). How can I improve binding without starting over? A: Your exploratory design has achieved a proof-of-concept interaction. Now, reliability in binding needs to be engineered.
- Troubleshooting Steps:
- Identify Weak Links: Determine if the issue is on-rate (poor shape complementarity) or off-rate (lack of stabilizing interactions). Analyze the binding interface from a co-crystal structure or AlphaFold3 prediction.
- Affinity Maturation: Create a focused mutagenesis library targeting only the interface residues (e.g., using NNK codons). Screen for improved binders using a method with higher throughput than ITC (e.g., biolayer interferometry (BLI) or flow cytometry).
- Anchor & Optimize: If the interface is large, identify a sub-region with good shape complementarity and "anchor" it. Then, optimize the surrounding residues through iterative design-test cycles.
Experimental Protocols
Protocol 1: Thermal Shift Assay for Rapid Stability Profiling
Purpose: To determine the melting temperature (Tm) of a protein, comparing novel designs to stable controls. Materials: Purified protein, SYPRO Orange dye, real-time PCR machine, 96-well optical plate. Method:
- Dilute SYPRO Orange dye to 5X in assay buffer (e.g., PBS).
- Mix 20 µL of protein sample (0.2-0.5 mg/mL) with 5 µL of 5X dye in a PCR plate well.
- Run a temperature ramp from 25°C to 95°C at a rate of 1°C/min, with fluorescence measurement (ROX channel) at each step.
- Plot fluorescence vs. temperature. Fit a sigmoidal curve to determine the inflection point (Tm).
Protocol 2: Site-Saturation Mutagenesis for Balancing Flexibility & Stability
Purpose: To introduce controlled flexibility at a specific position to recover function. Materials: Plasmid DNA, primers with NNK degenerate codon, high-fidelity DNA polymerase (e.g., Q5), DpnI. Method:
- Design forward and reverse primers containing the NNK codon (encodes all 20 aa + TAG stop) at the target residue.
- Perform a whole-plasmid PCR amplification.
- Digest the PCR product with DpnI (37°C, 1 hr) to degrade the methylated parent template.
- Transform the digested product into competent E. coli, plate on selective media, and sequence individual colonies to characterize the library.
Table 1: Comparison of Stabilization Strategies for Novel Folds
| Strategy | Method | Typical ΔTm Gain | Risk to Novel Function | Best Use Case |
|---|---|---|---|---|
| Computational Redesign | Rosetta ddg_monomer / FlexDDG |
+2°C to +10°C | Medium (if active site perturbed) | Pre-experiment in silico stabilization |
| Ancestral Sequence Reconstruction | Phylogenetic inference & resurrection | +5°C to +15°C | Low (preserves historical function) | Adding reliability to an exploratory functional motif |
| Consensus Design | Multiple sequence alignment averaging | +3°C to +8°C | High (can average out unique features) | Stabilizing a novel scaffold with low natural identity |
| Laboratory Evolution | Random mutagenesis & selection for stability | +5°C to >20°C | Variable | Post-hoc stabilization of a functional but unstable hit |
Table 2: Troubleshooting Functional Failures in Novel Designs
| Symptom | Likely Cause (Exploration Bias) | Diagnostic Experiment | Mitigation (Adding Reliability) |
|---|---|---|---|
| No expression in E. coli | Codon bias, toxic sequences, no fold | mRNA quantification, aggregation test | Optimize codons, use lower temp induction, fuse to solubility tag |
| Soluble but monodisperse only at low [ ] | Marginal stability, exposed hydrophobics | Analytical SEC at 1-5 mg/mL, Tm assay | Add stabilizing mutations from homologs |
| Binds target but no catalysis | Rigid/ misaligned active site | MD simulation, ligand docking | Introduce flexibility loops, redesign electrostatic networks |
| High activity but poor thermo-stability | Over-optimized for dynamics | Tm assay, activity after 1hr @ 40°C | Add distal disulfide or salt bridge |
Visualizations
Diagram 1: Protein Design Spectrum & Decision Flow
Title: Design Spectrum and Troubleshooting Flow
Diagram 2: Stability-Function Optimization Cycle
Title: Stability-Function Balance Cycle
The Scientist's Toolkit: Research Reagent Solutions
| Reagent / Material | Function in Balancing Exploration & Reliability | Example Product / Specification |
|---|---|---|
| SYPRO Orange Dye | Binds to exposed hydrophobic patches upon protein unfolding; enables high-throughput thermal stability (Tm) screening of novel designs. | Thermo Fisher Scientific, Cat. #S6650 |
| NNK Degenerate Codon Oligos | Encodes all 20 amino acids + one stop codon; essential for creating smart, focused mutagenesis libraries to refine exploratory hits. | Integrated DNA Technologies (IDT), Ultramer DNA Oligos |
| HisTrap HP Column | Standardized immobilized metal affinity chromatography (IMAC) for reliable, high-yield purification of His-tagged novel proteins across expression batches. | Cytiva, Cat. #17524801 |
| Octet RED96e System | Biolayer interferometry (BLI) platform for medium-throughput kinetic screening (kon, koff, Kd) of binding function in crude supernatants, accelerating design-test cycles. | Sartorius |
| Q5 High-Fidelity DNA Polymerase | Provides highly reliable PCR amplification for gene synthesis and library construction, minimizing cloning errors that could confound analysis of exploratory designs. | New England Biolabs, Cat. #M0491S |
| Rosetta Software Suite | Premier computational protein modeling suite for both de novo exploration (fold design) and reliability optimization (energy minimization, ddg_monomer). |
https://www.rosettacommons.org/ |
In the field of protein sequence design, a fundamental tension exists between exploring novel, high-variance sequences and exploiting known, reliable motifs. Over-emphasis on exploration can lead to experimental failures due to structural instability or misfolding, while excessive conservation limits functional innovation and the discovery of superior designs. This Technical Support Center provides resources for navigating this balance, offering troubleshooting and experimental guidance grounded in current research.
Troubleshooting Guides & FAQs
FAQ: How do I diagnose a failed expression experiment for a novel protein variant?
Answer: Failed expression is a common issue when exploring highly novel sequences. Follow this diagnostic tree:
- Check Plasmid Integrity & Sequence: Confirm the insert sequence via Sanger sequencing. Verify promoter/ribosome binding site compatibility with your expression system (e.g., T7 for E. coli, CMV for mammalian).
- Assess Cell Health & Biomass: Low final biomass suggests toxicity. Plate serial dilutions on selective media to check for colony formation. Consider using a tightly regulated expression system (e.g., pET with lactose/IPTG, or an arabinose-inducible system) to mitigate toxicity during growth.
- Run an SDS-PAGE Gel: Load total cell lysate. If no band is visible at the expected molecular weight, the protein may be degraded.
- Action: Co-express with chaperone proteins (e.g., GroEL/ES, DnaK/DnaJ), lower the induction temperature (e.g., to 18-25°C), or add a protease inhibitor cocktail.
- If an insoluble pellet is suspected: Lys cells and centrifuge. Solubilize the pellet in urea or guanidine HCl and run on a gel. A band in the pellet fraction indicates inclusion bodies.
- If a band is present but purification fails: The protein may be aggregated or improperly folded. Analyze via size-exclusion chromatography (SEC) or dynamic light scattering (DLS).
FAQ: My conserved design is stable but lacks the desired catalytic activity. What are my next steps?
Answer: This is a hallmark of over-conservation. You must strategically introduce variation.
- Identify Functional Hotspots: Use a tool like
SCHEMAorRosettato identify sectors (co-evolving residues) or active site-adjacent positions that are predicted to modulate function without disrupting the fold. - Employ Saturation Mutagenesis: At 2-3 key positions, perform site-saturation mutagenesis via NNK codons. Use a high-throughput activity screen (e.g., fluorescence, growth selection) to identify beneficial point mutations.
- Explore Chimeric Designs: Create chimeras by recombining segments from homologous proteins with diverse functional profiles. Use tools like
SCHEMAto minimize disruptive contacts at fragment boundaries.
FAQ: How can I quantitatively assess the "exploratory risk" of a designed protein library before wet-lab experiments?
Answer: Utilize computational stability and fitness predictors to pre-screen libraries.
| Metric/Tool | Purpose | Typical Threshold for "High-Risk" | Interpretation |
|---|---|---|---|
| ΔΔG (Rosetta/ddG) | Predicts change in folding free energy. | > +2.0 kcal/mol | High probability of destabilization. |
| Predicted pLDDT (AlphaFold2) | Per-residue confidence score (0-100). | Average pLDDT < 70 | Low confidence in overall backbone structure. |
| AGADIR (for helices) | Predicts helix propensity. | < 5% propensity | Low chance of maintaining helical structure. |
| Conservation Score (HSSP) | Measures evolutionary conservation. | Score of 0 at a core position | Mutation at this highly conserved site is risky. |
- Protocol for Computational Pre-screening:
- Generate your sequence library (e.g., 10,000 variants).
- Run all sequences through a structure predictor (e.g., AlphaFold2 via ColabFold) or a folding energy calculator (e.g., Rosetta
fold_and_dockfor complexes). - Filter out sequences with average pLDDT < 70 or ΔΔG > +3.0 kcal/mol.
- For the remaining (~10-20%), perform more detailed molecular dynamics (MD) simulations (e.g., 50 ns) to check for early unfolding events. This creates a computationally validated, lower-risk library for experimental testing.
Key Experimental Protocols
Protocol 1: Deep Mutational Scanning (DMS) to Balance Exploration & Conservation
- Objective: Empirically measure the fitness effects of thousands of single-point mutants in a single experiment.
- Method:
- Library Construction: Use PCR-based site-saturation mutagenesis to create a plasmid library covering all amino acid substitutions at targeted positions.
- Selection: Clone library into a phage or yeast display vector, or transform into a bacterial strain where function links to growth.
- Challenge: Subject the population to a functional challenge (e.g., binding to a target, thermal stress, enzymatic reaction with a substrate).
- Sequencing & Analysis: Use next-generation sequencing (NGS) to count variant frequency before and after selection. Calculate enrichment scores (log₂(Final/Initial)).
- Data Integration: Map scores onto a protein structure. Identify positions where mutations are highly deleterious (require conservation) and those that are permissive (allow exploration).
Protocol 2: Multi-State Design for Functional Exploration
- Objective: Design sequences that are stable in multiple conformational states (e.g., apo and holo forms) to enable functional innovation.
- Method (using Rosetta):
- Prepare Input Files: Obtain PDB files for the different target states (e.g., open/closed, bound/unbound).
- Define Residue Positions: Specify which positions are allowed to design (typically substrate-binding pocket, hinge regions) and which are fixed (structural core).
- Run Multi-State Design Script: Use the
RosettaScriptsinterface with theMultiStateDesignmover. This optimizer finds a single sequence that minimizes the energy across all provided states. - Filter & Select: Rank output sequences by calculated average energy across states and by the smallest energy gap between the lowest and highest energy state. Select top candidates for experimental testing.
Visualizations
Title: Risk and Strategy Flow in Protein Design
Title: Deep Mutational Scanning Experimental Workflow
The Scientist's Toolkit: Key Research Reagent Solutions
| Reagent / Material | Function / Role in Balancing Exploration & Conservation |
|---|---|
| NNK Degenerate Codon Oligos | Enables site-saturation mutagenesis to explore all 20 amino acids at a target position with a single primer mixture. |
| Phage or Yeast Display Vectors (e.g., pIII, pYD1) | Provides a physical link between protein variant (phenotype) and its encoding DNA (genotype), enabling high-throughput selection and screening. |
| Thermostable Polymerase (Q5 or Phusion) | High-fidelity PCR for accurate library construction, minimizing spurious mutations during amplification. |
| RosettaSoftware Suite | Computational protein design platform for predicting stability (ΔΔG), performing multi-state design, and generating sequence libraries. |
| ColabFold (AlphaFold2+MMseqs2) | Provides fast, accurate protein structure prediction for novel sequences, allowing in-silico stability checks (via pLDDT score). |
| Next-Generation Sequencing (NGS) Service/Kit | Essential for Deep Mutational Scanning (DMS) to quantitatively measure variant fitness from complex pooled libraries. |
| Chaperone Plasmid Sets (e.g., Takara pG-KJE8) | Co-expression of chaperones like GroEL/ES can improve solubility of unstable, exploratory designs, rescuing some "high-risk" variants. |
| Size-Exclusion Chromatography (SEC) Column (e.g., Superdex 75) | Critical analytical tool to assess monodispersity and oligomeric state, diagnosing aggregation in failed purifications. |
Technical Support Center: Troubleshooting Protein Sequence Design Experiments
FAQs & Troubleshooting Guides
Q1: My designed protein library shows no functional variants in high-throughput screening, despite high predicted stability. What could be wrong? A: This often indicates an over-reliance on reliability (stability) metrics at the cost of exploration (functional diversity). Natural evolution balances these via mechanisms like somatic hypermutation, which introduces targeted diversity.
- Troubleshooting Steps:
- Analyze Library Diversity: Calculate the pairwise sequence similarity within your designed library. If the average similarity is >80%, your exploration space is too narrow.
- Check Fitness Landscape Model: Your predictive model may be suffering from "model collapse," where it only reinforces already stable sequences. Incorporate stochasticity or use an ensemble of models.
- Protocol – Introduce Controlled Diversity: Implement an in silico directed evolution protocol. Start with your stable backbone and use a Position-Specific Scoring Matrix (PSSM) derived from homologous natural sequences to guide residue substitutions at non-conserved positions, mimicking affinity maturation.
- Method: Use tools like
HMMERto build a PSSM. For each target position, allow substitutions with a probability weighted by the PSSM frequency, with a scaling factor (e.g., 0.7 for conservation, 0.3 for exploration).
- Method: Use tools like
- Key Data Metrics to Review:
- Library sequence entropy (should be >2.0 bits per variable position for meaningful exploration).
- In-silico docking score distribution (should show a spread, not a single peak).
Q2: How can I mitigate "off-target" binding or aggregation in my designed binding proteins? A: The immune system uses central and peripheral tolerance mechanisms to eliminate self-reactive clones. Translate this to your design pipeline.
- Troubleshooting Steps:
- Perform Negative Design In Silico: Explicitly design against non-target structures. For a protein binder, include negative design steps against homologous human proteins or common aggregation motifs (e.g., beta-sheet patches).
- Protocol – Negative Design Simulation:
- Method: During sequence optimization (e.g., using Rosetta
ProteinMPNNorRFdiffusion), add a negative energy term. For each candidate sequence, perform a brief (1-5 ns) molecular dynamics (MD) simulation or a fast folding prediction (e.g.,AlphaFold2on distilled models) in the presence of "off-target" protein structures. Penalize sequences that show stable docking (< -50 kcal/mol) or folding into off-target conformations.
- Method: During sequence optimization (e.g., using Rosetta
- Experimental Validation: Use BLI or SPR in a competition assay with the off-target protein to screen for cross-reactivity early.
Q3: My exploration algorithms generate highly novel folds, but they are insoluble when expressed in E. coli. How can I improve experimental reliability? A: Natural evolution operates within biophysical constraints. Your exploration must be bounded by these "rules" for reliable translation.
- Troubleshooting Steps:
- Incorporate Solubility & Expression Filters: Integrate predictors like
DeepSol,SoluProt, orPROSO IIinto your generative model's loss function. - Protocol – Bounded Exploration with Hallucination:
- Method: Use a protein "hallucination" framework (e.g.,
RosettaorProteinMPNNhallucination). Start with a loss function that favors novelty (e.g., low similarity to PDB). Then, add iterative constraints: a) predicted solubility score > 0.7, b) predicted aggregation propensity (viaTANGOorAGGRESCAN) below a threshold, c) codon adaptation index (CAI) for your expression host > 0.8. Optimize for 3-5 cycles.
- Method: Use a protein "hallucination" framework (e.g.,
- Use a Chaperone Co-expression System: As a standard practice, express problematic designs in BL21(DE3) cells with a co-expressed chaperone plasmid (e.g.,
pG-KJE8forGroEL/GroESandDnaK/DnaJ/GrpE).
- Incorporate Solubility & Expression Filters: Integrate predictors like
Key Experiment Data Summary
Table 1: Comparison of Library Design Strategies Balancing Exploration and Reliability
| Strategy | Exploration Metric (Avg. Seq. Entropy) | Reliability Metric (% Soluble Expression) | Key Lesson from Biological Precedent |
|---|---|---|---|
| Purely Stability-Based | 1.2 bits | 85% | Over-optimization leads to narrow diversity, akin to low-affinity IgM precursors. |
| Random Mutagenesis | 4.5 bits | 12% | Unguided exploration is highly inefficient, similar to untemplated V(D)J recombination. |
| Somatic Hypermutation-Inspired (PSSM-Guided) | 3.1 bits | 65% | Targeted diversity around a stable scaffold balances novelty and function. |
| Negative Design-Augmented | 2.8 bits | 78% | Explicit negative selection mimics immune tolerance, improving specificity. |
The Scientist's Toolkit: Research Reagent Solutions
Table 2: Essential Materials for Reliable Exploration in Protein Design
| Item | Function in Context |
|---|---|
| Rosetta Suite or ProteinMPNN | Computational core for sequence design and energy-based scoring, enabling both exploration (hallucination) and reliability (fixbb). |
| AlphaFold2 or ESMFold | Rapid structure prediction for novel sequences, providing a reliability check for fold integrity. |
| pET Series Vectors & BL21(DE3) Cells | Standard high-yield protein expression system for initial soluble expression screening. |
| Chaperone Plasmid Sets (e.g., Takara pG-Tf2) | Co-expression vectors to improve soluble yield of challenging, exploration-driven designs. |
| HisTrap HP Column & ÄKTA System | Standardized purification workflow for reliable, high-throughput protein recovery. |
| Bio-Layer Interferometry (BLI) Octet System | Label-free, high-throughput binding kinetics analysis to functionally screen diverse libraries. |
| Cytiva HiPrep Desalting Column | Essential for rapid buffer exchange post-purification, ensuring consistent sample conditions for assays. |
Experimental Protocol Visualizations
Title: Somatic Hypermutation-Inspired Design Workflow
Title: Conceptual Framework Linking Biology to Design
Welcome to the Technical Support Center for Fitness Landscape Navigation in Protein Design. This resource provides troubleshooting guides and FAQs framed within the critical thesis of Balancing exploration and reliability in protein sequence design research.
Frequently Asked Questions (FAQs) & Troubleshooting
Q1: Our directed evolution campaign has stalled, with successive rounds showing no improvement in function. We suspect we are stuck in a local optimum on a rugged fitness landscape. What strategies can we use to escape?
A1: This is a classic symptom of navigating a rugged landscape. Implement the following protocol to enhance exploration:
- Introduce Controlled Diversity: Shift from strict "top-N" selection to a probabilistic selection scheme (e.g., using fitness-proportional or tournament selection) to preserve some beneficial but sub-optimal variants.
- Increase Mutation Rate/Scope: Temporarily increase the mutation rate or use "soft randomization" focused on structurally permissive regions (guided by SCHEMA or 3D modeling) to create a larger jump in sequence space.
- Recombination: Introduce DNA shuffling or fragment recombination between diverse, high-fitness parents from different branches of your phylogenetic tree to create chimeric escapes.
- Alternate Fitness Pressure: If possible, apply a secondary or orthogonal selection pressure (e.g., stability under harsh conditions) to reveal peaks in a different dimension of the landscape.
Q2: How do we effectively map a sparse fitness landscape where functional variants are rare? High-throughput screening is expensive and low-throughput assays are not informative enough.
A2: Employ a tiered, model-guided exploration strategy.
- Experimental Protocol: Sparse Landscape Mapping
- Initial Probing: Use a deep mutational scanning (DMS) approach on a critical sub-domain. Even a low-coverage DMS can identify "hotspots" and "coldspots" for mutation.
- Predictive Filtering: Input DMS data into a machine learning model (e.g., variational autoencoder, Potts model) to predict the fitness of unsampled sequences.
- Focused Library Design: Generate a focused library of 10^4-10^5 variants enriched with sequences the model predicts as functional, plus a stochastic exploration component (~20% of library).
- Iterate: Use the new screening data to retrain the model and design the next library cycle.
Q3: Our ML model for fitness prediction performs well on validation data but fails to generalize and guide us to novel, high-fitness sequences. What might be wrong?
A3: This often indicates overfitting to a narrow region of the landscape or a training-test data leak. Troubleshoot as follows:
- Audit Training Data: Ensure your training and validation sets are phylogenetically separated. Use tools like
FastTreeto build a phylogenetic tree and split clusters. - Incorporate Uncertainty Estimation: Implement or switch to models that provide uncertainty estimates (e.g., Gaussian processes, ensembles, Bayesian neural networks). Prioritize exploring regions of high predicted fitness AND high uncertainty.
- Add Diverse Negative Data: Include confirmed low-fitness or non-functional sequences in training to better define the "valleys" and improve landscape topography prediction.
- Feature Evaluation: Re-evaluate your input features (e.g., evolutionary covariance, physicochemical properties, structural metrics). Ensure they are informative for novel sequences, not just interpolating between known ones.
Q4: When designing a new protein scaffold, how do we balance exploring radically new folds (high risk) versus optimizing known, stable folds (high reliability)?
A4: Adopt a phased "Explore-Exploit" pipeline with clear decision gates.
- Experimental Protocol: Phased Scaffold Design
- Phase 1 - Exploration (De Novo Focus): Use generative models (e.g., RFdiffusion, ProteinMPNN) to produce a diverse set of in silico scaffolds filtered for predicted folding confidence (pLDDT > 70). Synthesize and test a small batch (10-20) for basic expression and stability.
- Decision Gate: If ≥10% of exploratory scaffolds show promise, proceed. If not, expand exploration with different generative constraints or revert to a known, reliable backbone.
- Phase 2 - Exploitation (Optimization Focus): Take the most promising 1-2 scaffolds from Phase 1. Perform focused combinatorial mutagenesis on surface loops or active sites, using a high-throughput functional screen (e.g., yeast display + FACS).
- Phase 3 - Reliability Engineering: On your top functional variant, run a consensus-stability or computational stability scan (Rosetta ddG) to introduce stabilizing mutations without affecting function.
Table 1: Comparison of Landscape Navigation Strategies
| Strategy | Primary Goal | Typical Library Size | Key Risk | Best For |
|---|---|---|---|---|
| Saturation Mutagenesis | Exhaustively map a local site | 10^2 - 10^3 | Misses epistatic effects | Identifying key residues, fine-tuning |
| Directed Evolution (AVEx) | Climb local peak | 10^6 - 10^9 | Local optimum trapping | Optimizing an existing function |
| Family Shuffling | Recombine functional blocks | 10^5 - 10^7 | Generate non-functional chimeras | Exploring within a known fold family |
| Generative Model Design | Explore novel sequence space | 10^2 - 10^4 (physical) | Poor in vivo folding | De novo scaffold discovery |
| Model-Guided Iteration | Navigate sparse rewards | 10^4 - 10^5 per cycle | Model overfitting/error | When functional variants are <1% |
Table 2: Key Metrics for Fitness Landscape Analysis
| Metric | Calculation / Tool | Interpretation | Threshold for Action |
|---|---|---|---|
| Epistasis Density | Fraction of variant pairs showing non-additive effects | High density = Rugged landscape | >0.3 indicates strong need for exploration tactics |
| Sparsity Index | 1 - (Functional Variants / Total Variants Tested) | High index = Sparse landscape | >0.99 necessitates model-guided or ultra-deep screening |
| Predictive R² | Correlation (Predicted vs. Actual Fitness) on held-out clusters | Generalization ability of model | R² < 0.4 on cluster hold-out suggests model cannot guide exploration |
Visualizations
Diagram Title: Phased Explore-Exploit Protein Design Workflow
Diagram Title: Model-Guided Iterative Exploration Cycle
The Scientist's Toolkit: Key Research Reagent Solutions
| Item / Reagent | Function in Landscape Navigation | Example / Note |
|---|---|---|
| NGS-based Deep Mutational Scanning (DMS) | Enables ultra-high-throughput fitness measurement for thousands of variants in parallel, mapping local landscape topography. | Use EMPIRIC or DIMPLE protocols for yeast surface display coupling. |
| Phage/ Yeast Display Libraries | Provides a physical linkage between genotype (DNA) and phenotype (protein function) for screening vast combinatorial libraries (>10^9). | Crucial for exploring rugged landscapes via directed evolution. |
| Rosetta Suite Software | Computational protein modeling for predicting stability (ddG) and structure, used to in silico pre-filter libraries and assess reliability. | RosettaDDGPrediction protocol for scanning stability. |
| RFdiffusion & ProteinMPNN | Generative AI models for de novo protein backbone design and sequence scaffolding, enabling radical exploration of fold space. | Key for exploring sparse regions beyond natural homologs. |
| Trimmomatic & FastTree | Bioinformatics tools for processing NGS data and constructing phylogenetic trees to ensure robust train/test splits for ML models. | Prevents data leakage, improving model generalizability. |
| Fluorescence-Activated Cell Sorting (FACS) | High-precision isolation of functional protein variants based on activity or binding, enabling selection from complex libraries. | Essential for the "exploitation" phase to climb fitness peaks. |
| Thermofluor (DSF) Assay | High-throughput measurement of protein thermal stability (Tm), a key reliability metric during optimization. | Use to ensure exploration does not catastrophically compromise stability. |
Bridging the Gap: Methodologies for Balanced Sequence Generation and Application
Technical Support Center
Troubleshooting Guide
Issue 1: Model Collapse in Conditional VAE Training Q: My conditional VAE for protein sequence generation is producing low-diversity, repetitive outputs. How can I diagnose and fix this? A: Model collapse is often due to an imbalanced Kullback-Leibler (KL) divergence term or a poorly structured latent space. Follow this protocol:
- Monitor KL Loss: Track the KL loss component during training. A rapid drop to near-zero indicates collapse.
- Adjust Beta (
β): Implement aβ-VAE framework. Start withβ = 0.001and gradually anneal it according to a schedule (e.g., increase to 0.1 over 50 epochs). Use the following table as a guideline:Epoch Range Beta (β) Value Purpose 1-20 0.001 to 0.01 Allow encoder to learn useful representations. 21-100 0.01 to 0.05 Gradually enforce latent space structure. 100+ 0.05 to 0.1 (max) Balance diversity and reconstruction. - Latent Space Inspection: Use PCA or UMAP to visualize the latent space for different conditions. Clustered, non-overlapping distributions are good; a single tight cluster indicates collapse.
- Decoder Strength: Reduce the initial learning rate of the decoder by a factor of 10 relative to the encoder to prevent it from overpowering the latent regularization too quickly.
Issue 2: Blurry or Unrealistic Samples from Diffusion Models Q: My diffusion model for protein backbone generation produces "averaged" or physically improbable structures. What steps should I take? A: This is typically a problem with the noise schedule and sampling process.
- Noise Schedule Analysis: Verify your variance schedule (
β_t). A linear schedule often leads to suboptimal results. Switch to a cosine schedule, which adds noise more slowly at the start and end. - Sampling Steps: Increase the number of reverse diffusion steps during sampling. While training might use 1000 steps, sampling can often use 250-500 steps with a DDIM sampler for clarity.
- Classifier-Free Guidance Scale: If using conditional generation, tune the guidance scale (
ω). High values can distort samples; low values reduce condition fidelity. Perform a grid search:Guidance Scale (ω) Result on Generated Protein Recommended Use 1.0 High diversity, low condition fidelity. Initial exploration. 3.0 - 5.0 Good balance of fidelity and novelty. Standard design. 7.0 - 10.0 High fidelity, reduced diversity. High-reliability scaffold grafting. - Loss Function: Incorporate a secondary loss term, such as a lightweight physics-based potential (e.g., Lennard-Jones clashes), into the training objective to penalize unrealistic conformations.
Issue 3: Poor Conditioning in Hierarchical Models Q: In my two-stage model (VAE for sequence, diffusion for structure), the final structure does not reflect the intended conditional property (e.g., stability). A: This is a conditioning leakage problem. Ensure gradient flow and information consistency.
- Gradient Check: Use automatic differentiation tools to verify that gradients from the final property predictor (e.g., stability predictor) propagate back through both the diffusion and VAE models. Frozen layers are a common culprit.
- Conditional Bottleneck: Introduce a dedicated, small conditional embedding network that processes your target property (e.g., ΔΔG) and injects it into both the VAE's latent space and the diffusion model's cross-attention layers. This creates multiple conditioning points.
- Alignment Metric: Implement a validation metric that explicitly measures the correlation between the generated samples' predicted properties and the target condition. Optimize for this metric directly.
Frequently Asked Questions (FAQs)
Q: How do I choose between a Conditional VAE (CVAE) and a Conditional Diffusion Model (CDM) for protein sequence design? A: The choice depends on your priority in the exploration-reliability trade-off.
- Use CVAE when: You need fast, diverse sampling and direct latent space interpolation for exploratory analysis. It's less computationally intensive for generation.
- Use CDM when: Your priority is sample quality and reliability, and you can afford longer sampling times. Diffusion models typically generate higher-fidelity, more physically plausible sequences/structures.
- Hybrid Approach: A common strategy is to use a CVAE for rapid exploration of the sequence space and a CDM for high-fidelity refinement of top candidates.
Q: What is a practical method to quantitatively evaluate "controlled diversity"? A: Use a combination of metrics, reported in a unified table for each model run:
| Metric | Formula/Description | Target for Controlled Diversity |
|---|---|---|
| Conditional Accuracy | Percentage of generated samples that meet the target property threshold (e.g., binding affinity > X). | High (>80%). Ensures reliability. |
| Intra-condition Diversity | Average pairwise Levenshtein distance (sequence) or RMSD (structure) within a condition group. | Moderate to High. Avoids collapse. |
| Inter-condition Separation | Silhouette score of latent embeddings grouped by condition. | High (>0.5). Clear condition control. |
| Novelty | Percentage of generated sequences not found in the training dataset (BLAST evalue > 1e-5). | User-defined. Balances exploration. |
Q: How can I incorporate a known protein motif as a hard constraint during generation? A: Use masked generation or inpainting.
- For Sequences (CVAE/Diffusion): Fix the tokens of the known motif during sampling. In diffusion, this is done by only adding noise to the "unknown" regions and denoising the full sequence conditioned on the fixed motif.
- For Structures (Diffusion): Use a 3D inpainting technique. Define a mask over the coordinates of the motif (set noise to zero) and only apply the diffusion process to the flexible regions. The model will generate a coherent structure that accommodates the fixed motif.
Experimental Protocols
Protocol 1: Training a Conditional VAE for Stable Protein Variants
Objective: Generate diverse protein sequences predicted to have high thermal stability (ΔΔG > 0) relative to a wild-type.
- Data Preparation: Curate a dataset of protein variants with experimentally measured ΔΔG. Represent sequences as one-hot tensors (L x 20). Normalize ΔΔG values.
- Model Architecture:
- Encoder: 1D CNN + bidirectional LSTM. Outputs
μandlog(σ)for a 128-dim latent vectorz. - Conditioning: Concatenate the target ΔΔG value to the encoder's flattened output and to the decoder's input.
- Decoder: Two-layer LSTM followed by a linear layer with softmax.
- Encoder: 1D CNN + bidirectional LSTM. Outputs
- Training: Use a loss
L = L_recon + β * L_KL. Use β-annealing from 1e-4 to 0.05 over 200 epochs. Adam optimizer (lr=3e-4). - Validation: Monitor (a) reconstruction accuracy on hold-out wild-types, and (b) the correlation between the target ΔΔG and the predicted ΔΔG (via a separate predictor) of generated samples.
Protocol 2: Fine-tuning a Latent Diffusion Model for Backbone Inpainting
Objective: Given a fixed protein scaffold and a defined active site region, generate diverse, plausible backbone conformations for the active site.
- Data & Featurization: Use the PDB to create training samples. Represent structures as backbone atom point clouds (N, Cα, C). For each sample, create a binary mask (1 for active site, 0 for scaffold).
- Model Setup: Start from a pre-trained unconditional protein diffusion model (e.g., RFDiffusion AlphaFold2 module). Modify the input to concatenate coordinate features with the mask channel.
- Conditional Training: Train only on the denoising task for the masked region. The loss is calculated only on the coordinates of the masked (active site) residues. The scaffold coordinates are passed as context but are not updated.
- Sampling: Use the DDIM sampler with 200 steps. The scaffold coordinates are fixed (no noise added). Noise is initialized only for the masked region, and the reverse process generates the new active site.
Visualizations
Diagram Title: CVAE-Diffusion Hybrid Workflow for Protein Design
Diagram Title: Conditional VAE Loss Components
The Scientist's Toolkit: Research Reagent Solutions
| Item | Function in Generative Protein Design |
|---|---|
| ESMFold / AlphaFold2 | Protein structure prediction networks. Used as a rapid in-silico validation tool to assess the foldability of AI-generated sequences. Critical for reliability. |
| PyRosetta | Software suite for computational structural biology. Used to calculate physics-based energy scores (Rosetta Energy Units) and refine AI-generated models, adding a reliability check. |
| ProteinMPNN | A state-of-the-art inverse folding model. Often used after a generative model to "fix" or redesign sidechains for a given AI-generated backbone, enhancing plausibility. |
| PDB (Protein Data Bank) | The primary source of experimental protein structures. Used for training data, defining scaffolds, and benchmarking generated samples. |
Beta (β) Scheduler |
A software module to dynamically adjust the KL loss weight in a VAE during training. Essential for preventing posterior collapse and achieving controlled diversity. |
| Classifier-Free Guidance | An inference-time scaling technique for diffusion models. The key "knob" to tune the exploration (diversity) vs. reliability (condition fidelity) trade-off. |
| DDIM Sampler | An accelerated sampler for diffusion models. Allows for high-quality generation in fewer reverse steps (e.g., 250 vs. 1000), speeding up the design cycle. |
Technical Support Center
Troubleshooting Guides & FAQs
Q1: My smart library, designed using a generative model, shows extremely low expression in E. coli. What could be the cause and how can I resolve it?
A: Low expression from a computationally designed library often stems from overlooked host-specific translational or folding rules. First, check the codon adaptation index (CAI) of your designed sequences using a tool like the EMBOSS cai program. Aim for a CAI >0.8 for E. coli. If CAI is low, perform in silico codon optimization, but avoid creating strong mRNA secondary structures near the ribosome binding site. Second, verify that your mutations have not unintentionally created aggregation-prone regions; use tools like TANGO or Aggrescan. Troubleshooting Protocol: 1) Clone and express 3-5 individual variants to confirm the issue is systemic. 2) Subclone your library into a vector with a stronger, tunable promoter (e.g., T7 or araBAD) to rule out promoter weakness. 3) Co-express with chaperone plasmids (e.g., pG-KJE8) to test if misfolding is the bottleneck.
Q2: During FACS-based screening, I observe a high rate of false positives. How can I improve sorting fidelity? A: High false positives in FACS often link to signal leakage or non-specific binding. Implement the following: 1) Increase Stringency: Use a more stringent gating strategy. Include a negative control (cells with no enzyme or inactive mutant) to set the lower boundary and a "low-activity" control to define your minimum desired signal. Apply doublet discrimination gates (FSC-H vs FSC-A) to exclude cell aggregates. 2) Signal Validation: Employ a dual-labeling strategy. For example, if screening for enzymatic activity, use a substrate that generates a fluorescent product at a different wavelength than your cell-labeling dye (e.g., GFP expression). Gate only on cells that are positive for both. 3) Pre-sort Enrichment: If possible, use a magnetic bead-based pre-enrichment step to remove the bulk of inactive clones before FACS, reducing background pressure.
Q3: The sequence-activity relationship data from my high-throughput screen is noisy and no clear fitness landscape emerges. What steps should I take? A: Noisy data can obscure evolutionary trajectories. 1) Replicate Screening: Perform at least three biological replicates of your screen. Calculate the coefficient of variation (CV) for each variant's measured activity. Filter out variants where the CV > 20% as unreliable. 2) Control Normalization: Use internal controls spiked into every screening plate. Include a known high-activity and a null variant. Normalize all raw reads or fluorescence values to the plate median of the high-activity control. 3) Apply Statistical Filters: Use a Z-score or median absolute deviation (MAD) threshold to identify hits significantly above the population median. A workflow for data refinement is provided below.
Title: Workflow for Refining Noisy HTS Data
Q4: When using machine learning to guide library design, how do I balance exploration of novel sequence space with exploitation of known productive regions? A: This is the core challenge of reliable sequence design. Implement an acquisition function within your active learning loop. 1) Algorithm Choice: Use Upper Confidence Bound (UCB) or Thompson sampling, which explicitly balance mean predicted fitness (exploitation) and prediction uncertainty (exploration). 2) Library Composition: Design each successive library as a blend: 70% of variants from the top of the exploitation ranking (high predicted value), 20% from the exploration ranking (high uncertainty), and 10% as random wild-card sequences to sample completely unexplored regions. This ratio can be adjusted based on iteration performance. The decision logic is visualized below.
Title: Balancing Exploration & Exploitation in Library Design
Q5: My high-throughput screening assay works in microtiter plates but fails when adapted to a microfluidic droplet format. What are common pitfalls? A: Droplet-based assays introduce new variables. Key issues and fixes: 1) Surface Binding: Your enzyme or substrate may adsorb to the droplet interface. Fix: Add non-ionic surfactants (e.g., 0.5-1% Pluronic F-68) and carrier proteins (0.1% BSA) to the aqueous phase. 2) Diffusion Limitations: The reaction may be quenched too slowly. Fix: Optimize the concentration of your quenching agent in the oil stream or collection buffer. Perform a time-course experiment in droplets to find the optimal incubation time before sorting. 3) Substrate Permeability: The substrate may not efficiently enter cells encapsulated in droplets. Fix: Use a substrate that is membrane-permeable or employ cell-free expression systems within droplets.
Table 1: Comparison of High-Throughput Screening Platforms
| Platform | Throughput (variants/day) | Cost per Variant | Typical False Positive Rate | Best for Library Type |
|---|---|---|---|---|
| Microtiter Plate (Robotic) | 10^4 | $0.50 - $2.00 | 5-15% | Small, focused libraries (<10^4) |
| Flow Cytometry (FACS) | 10^7 | $0.001 - $0.01 | 1-5%* | Large smart libraries (10^6 - 10^8) |
| Microfluidic Droplets | 10^8 | <$0.001 | 0.5-3%* | Ultra-large libraries (10^7 - 10^9) |
| Phage/yeast display | 10^9 | <$0.001 | Varies widely | Binding affinity, peptide libraries |
*With optimized gating and controls.
Table 2: Common Smart Library Design Strategies & Performance
| Design Strategy | Computational Model | Typical Library Diversity | Exploration vs. Reliability Bias | Key Experimental Validation |
|---|---|---|---|---|
| Site-Saturation Mutagenesis (SSM) | None (random) | 10^2 - 10^3 per site | High exploration, low reliability | Deep mutational scanning |
| Consensus Design | Sequence alignment | 10^1 - 10^2 | Low exploration, high reliability | Thermostability assays |
| TrRosetta/AlphaFold2 | Protein structure prediction | 10^3 - 10^4 | Moderate balance | Expression yield, solubility check |
| ProteinMPNN/RFdiffusion | Inverse folding, generative | 10^4 - 10^6 | Tunable (depends on training data) | Full functional screen required |
Experimental Protocol: Coupling FACS with NGS for Fitness Landscape Mapping
Objective: To quantitatively map the fitness of all variants in a smart library post-selection. Materials:
- Sorted cell populations (Top 1% and bottom 50% of activity).
- QIAamp DNA Micro Kit.
- PCR primers with overhangs for Illumina sequencing.
- KAPA HiFi HotStart ReadyMix.
- Illumina MiSeq or NextSeq system.
Methodology:
- Sorting: Perform FACS, collecting the top 1% (high-fitness) and bottom 50% (low-fitness/neutral) populations. Collect at least 10^6 cells per population.
- Genomic DNA Extraction: Isolate gDNA from both cell pools using the QIAamp kit. Elute in 30 µL.
- Amplification of Variant Region: Perform two-step PCR. Step 1: Amplify the variant gene region using gene-specific primers. Use ≤ 25 cycles. Step 2: Add Illumina flow cell adapters and unique dual indices (UDIs) using a limited-cycle (8-10 cycles) PCR.
- Sequencing: Pool purified libraries equimolarly and sequence on an Illumina platform to a depth of at least 500 reads per variant for the input library.
- Data Analysis: Count reads for each variant (barcode) in the Input, High, and Low populations. Calculate enrichment score (E) as: E = log2( (Counthigh / Totalhigh) / (Countinput / Totalinput) ). Filter variants with < 10 reads in input pool.
The Scientist's Toolkit: Research Reagent Solutions
Table 3: Essential Reagents for Directed Evolution 2.0 Workflows
| Item | Function | Example Product/Catalog # |
|---|---|---|
| Ultra-high fidelity DNA Polymerase | Error-free amplification of smart library constructs for cloning. | NEB Q5 High-Fidelity DNA Polymerase (M0491) |
| Golden Gate Assembly Mix | Efficient, seamless assembly of variant libraries into expression vectors. | NEB Golden Gate Assembly Kit (BsaI-HF v2) (E1601) |
| Membrane-permeable fluorogenic substrate | Enables intracellular enzyme activity screening in FACS or droplets. | Thermo Fisher Scientific LiveBLAzer FRET B/G Substrate |
| Next-generation sequencing kit | For deep mutational scanning and fitness landscape analysis. | Illumina DNA Prep Kit (20018705) |
| Chaperone plasmid set | Co-expression to improve folding of designed variants in E. coli. | Takara pG-KJE8 Chaperone Plasmid Set (3340) |
| Droplet generation oil & surfactant | For creating stable, biocompatible water-in-oil emulsions. | Bio-Rad Droplet Generation Oil for EvaGreen (1864005) |
Troubleshooting Guides & FAQs
Q1: My Rosetta design runs are producing structures with unexpectedly high total energy scores (positive REU). What are the primary causes and fixes?
A: Positive REF2015 or REF2021 energy values indicate instability. Common causes and solutions:
- Cause 1: Inadequate Relaxation. The designed sequence is strained in the starting backbone.
- Fix: Implement a more aggressive relaxation protocol after design. Use FastRelax with increased cycle counts (e.g.,
-default_max_cycles 200) and consider dual-space relaxation (-relax:dualspace true).
- Fix: Implement a more aggressive relaxation protocol after design. Use FastRelax with increased cycle counts (e.g.,
- Cause 2: Overly Restrictive Design Constraints. Over-constraining residue types (e.g., packing) can force incompatible sidechains.
- Fix: Use
-auto_detect_good_breakup trueduring packing or apply constraints via the-cst_fa_weightflag more judiciously, starting with lower weights (e.g., 1.0).
- Fix: Use
- Cause 3: Clashing from In-Parallel Design. Simultaneous optimization of many sidechains can create clashes.
- Fix: Use the
-packing:linmem_ig 10flag to improve packing accuracy and consider sequential design strategies.
- Fix: Use the
Q2: How do I balance the -fa_dun weight to improve backbone reliability without over-constraining sequence exploration?
A: The Dunbrack rotamer term (-fa_dun) is critical for reliability but can hinder exploration.
- High Weight (e.g., 0.7-1.0): Favors well-known, low-energy rotamers. Increases reliability of designs by selecting statistically common sidechain conformations. Use for conservative design near functional sites.
- Low/Zero Weight (e.g., 0.0-0.3): Allows exploration of novel rotamers. Use for de novo design or when exploring radically new sequences. Always follow with extensive full-energy scoring and relaxation to ensure reliability.
- Recommended Protocol: Start design with a lower weight (0.3) for exploration, then filter and refine top sequences with a standard weight (0.7) for reliability.
Q3: My designed proteins express but aggregate. Which energy terms should I re-evaluate to improve solubility and folding reliability?
A: Aggregation suggests exposed hydrophobic surface area or frustrated electrostatic interactions.
- Re-evaluate: The
-fa_sol(Lazaridis-Karplus solvation) and-fa_elec(FaElec2015) terms. - Experimental Protocol: Implement a post-design filter using the
InterfaceAnalyzermover orscore_jd2application to calculate the following metrics per design:- Hydrophobic SASA: Total SASA of apolar residues. Compare to natural monomeric proteins.
- ddG of Interface (for monomers): Should be positive and high, indicating no stable multimers.
- Electrostatic Complementarity: Use the
ECmetric. Poor scores (<0.5) suggest unfavorable polar interactions.
- Fix: Add a
-resfilecommand to repack surface residues with more polar amino acids (D, E, K, R, Q, N, S, T) based on the initial design's problematic patches.
Table 1: Impact of Energy Term Weighting on Design Outcomes
| Energy Term | Standard Weight (Reliability) | Low Weight (Exploration) | Key Metric Affected | Recommended Use Case |
|---|---|---|---|---|
-fa_dun (Rotamer) |
0.7 - 1.0 | 0.0 - 0.3 | Rotamer Probability | Lower for de novo cores; Standard for surface/interface |
-cst_fa_weight (Constraints) |
1.0 - 5.0 | 0.1 - 0.5 | Constraint Energy | Lower for initial exploration; Increase during refinement |
-relax:ramp_constraints |
true | false | Backbone Flexibility | Enable for reconciling conflicting constraints |
-fa_elec (Electrostatics) |
1.0 | Scale 0.5-2.0 | ddG Folding/Binding | Adjust to modulate polar interaction strength |
Table 2: Troubleshooting Energy Scores
| Problematic Output | Typical REF2015 Score Range | Target Score Range | Primary Diagnostic Movers |
|---|---|---|---|
| High-Energy Designs | > 50 REU | < 0 REU | FastRelax, PackRotamersMover |
| Unstable Backbone (post-relax) | > 100 REU (rama, paapp) | rama < 2, paapp < 1 | CartesianDDAMover, LoopModeler |
| Poor Interface Packing | InterfacedeltaX > 10 REU | InterfacedeltaX < -10 REU | InterfaceAnalyzer, FindInterfaceMotif |
Experimental Protocols
Protocol: Energy-Constrained Iterative Design for Reliability
- Input Preparation: Generate starting backbone(s) via remodeling or from a PDB. Define designable (
ALLAA/POLAR) and repackable (NATAA) residues using a.resfile. - Exploration Phase:
- Run
rosetta_scriptswith a reduced-fa_dun_weight(0.3) and moderate-cst_weight(1.0). - Use the
PackRotamersMoverwith-ex1 -ex2options to expand rotamer sampling. - Generate a large sequence diversity (5,000-10,000 designs).
- Run
- Energy-Based Filtering:
- Filter all outputs by total score (
ref2015_cartorref2021) and per-residue energy. - Select the top 10% by score for further analysis.
- Filter all outputs by total score (
- Reliability Refinement Phase:
- On filtered designs, run
FastRelaxwith standard energy weights (-fa_dun_weight 0.7) and-ramp_constraints true. - Apply
-dualspace trueif backbone moves are permitted.
- On filtered designs, run
- Validation Scoring:
- Score relaxed designs with
InterfaceAnalyzer(for complexes) orScoreMover. - Apply metrics from Table 2 as pass/fail filters.
- Output final designs with negative total energy and favorable sub-scores.
- Score relaxed designs with
Visualizations
Title: Rosetta Energy-Constrained Design Workflow
Title: Energy Constraint Logic in Rosetta
The Scientist's Toolkit: Research Reagent Solutions
Table 3: Essential Materials for Energy-Constrained Design Experiments
| Item | Function in Experiment | Key Consideration for Reliability |
|---|---|---|
| Rosetta Software Suite (v2024+) | Core platform for physics-based design and energy scoring. | Use the latest release for updated energy functions (e.g., REF2021). |
| High-Performance Computing Cluster | Enables large-scale sequence sampling and parallel relaxation runs. | Critical for generating statistically significant design libraries. |
| Structure Visualization Software (PyMOL, ChimeraX) | Visual inspection of designed models for packing, voids, and strain. | Essential for qualitative validation beyond energy scores. |
| Crystallography or Cryo-EM | Experimental high-resolution structure determination of top designs. | Ultimate validation of computational reliability and accuracy. |
| Differential Scanning Fluorimetry | Measures thermal stability (Tm) of expressed designs. | Correlates directly with computed total energy (REU). |
| SEC-MALS / DLS | Assesses monodispersity and aggregation state in solution. | Validates predictions from -fa_sol and interface energy terms. |
| Residue-Specific Constraints File | Defines desired H-bonds, distances, or motifs via Rosetta .cst format. |
Balances exploration (loose constraints) with reliability (tight constraints). |
Troubleshooting Guides & FAQs
Q1: I am encountering "CUDA out of memory" errors when running inference on ESM-2 or ESM-3 models. What are my options?
A: This is common when processing large proteins or batches. Solutions are tiered:
- Reduce Batch Size: Set
batch_size=1in your data loader. - Use Gradient Checkpointing: If training, enable activation checkpointing for memory-for-compute trade-off.
- Precision Reduction: Use mixed precision (
torch.cuda.amp) or load the model in FP16/BF16. - Model Truncation: Consider using a smaller variant (e.g., ESM-2 35M instead of 650M).
- Sequence Truncation: For very long sequences, analyze functional domains separately.
- Hardware: If possible, use a GPU with more VRAM (e.g., A100, RTX 4090/3090).
Q2: The per-residue log probabilities from my ESM model are extremely low (highly negative). Is this normal?
A: Yes. Log probabilities are negative, with more negative values indicating lower probability. The scale varies by model and sequence length. Focus on relative differences, not absolute values. For masked inference, the probability for the wild-type residue is often low, as the model is trained to predict likely alternatives.
Q3: How do I interpret the attention maps from a model like ESMFold or ESM-2? What do strong attention weights signify?
A: Attention weights indicate which residue pairs the model "attends to" when constructing a representation for a given residue. Strong weights often correlate with:
- Spatial proximity in the folded structure.
- Evolutionary co-variation (contacts).
- Functional relationships. Note: Attention is not a direct physical interaction map; it's a computational construct. Validate insights with structural data.
Q4: When using ESM embeddings for downstream tasks (e.g., fitness prediction), which layer's embeddings should I use?
A: There is no universal best layer. Performance depends on the task:
- Final Layer: Best for global, semantic features (e.g., protein family, solubility).
- Middle Layers (e.g., ~2/3 depth): Often capture structural and functional information optimal for variant effect prediction.
- Strategy: Conduct a simple hyperparameter sweep over layers on a validation set. A weighted combination of multiple layers can sometimes improve performance.
Table: ESM-2 Model Variants & Resource Requirements
| Model (ESM-2) | Parameters | Embedding Dim | Typical VRAM (Inference) | Max Sequence Length | Best For |
|---|---|---|---|---|---|
| esm2t68M_UR50D | 8 Million | 320 | ~1 GB | 1024 | Quick prototyping, embedding large families |
| esm2t1235M_UR50D | 35 Million | 480 | ~2 GB | 1024 | Balance of speed and accuracy |
| esm2t30150M_UR50D | 150 Million | 640 | ~4 GB | 1024 | High-quality embeddings for design |
| esm2t33650M_UR50D | 650 Million | 1280 | ~10 GB | 1024 | State-of-the-art representations |
| esm2t363B_UR50D | 3 Billion | 2560 | ~24 GB+ | 1024 | Cutting-edge research (requires high-end GPU) |
Q5: I want to use ESM to score designed sequences. Should I use masked marginal likelihood or pseudo-perplexity?
A: For scoring existing sequences without masking, use pseudo-log-likelihood (PLL). It computes the sum of log probabilities of each residue, conditionally masked on the rest of the sequence. Lower PPL (derived from PLL) indicates the sequence is more "natural" according to the model. This is a key metric for balancing exploration (new designs) with reliability (native-like sequences).
Detailed Experimental Protocol: Using ESM Pseudo-Likelihood to Evaluate Designed Protein Variants
Objective: Quantify the "naturalness" of a novel designed protein sequence using the ESM-2 model to compute its pseudo-perplexity (PPL), providing a prior for guiding exploration in design space.
Materials & Software:
- Python (3.8+)
- PyTorch (1.12+)
- FairSeq or Transformers (Hugging Face) library with ESM
- ESM-2 model weights (e.g.,
esm2_t33_650M_UR50D) - List of protein sequences in FASTA format.
Procedure:
- Environment Setup: Install required packages:
pip install fair-esm transformers torch. - Model Loading: Load the ESM-2 model and its associated tokenizer.
- Data Preparation: Tokenize the input sequence(s). Append a start (
<cls>) and end (<eos>) token as per model training. Pseudo-Likelihood Calculation: For each sequence position
i, mask tokeni(replace with<mask>), pass the sequence through the model, and retrieve the log probability assigned to the original residue at positioni.Aggregate Score: Sum the per-position log probabilities to get the total pseudo-log-likelihood (PLL) for the sequence.
Interpretation: Lower PPL values indicate the sequence is more probable under the model's learned evolutionary distribution. Compare designed variants against the wild-type PPL.
The Scientist's Toolkit: Research Reagent Solutions
| Item | Function in Sequence-Based Priors Research |
|---|---|
| ESM-2/ESM-3 Model Weights | Pre-trained protein language models that provide the foundational evolutionary prior for sequence scoring and embedding generation. |
| PyTorch / FairESM | Core deep learning framework and specific library for loading and running ESM models efficiently. |
| CUDA-Compatible GPU (e.g., NVIDIA A100, RTX 4090) | Accelerates model inference and training, essential for working with large models (650M+ parameters). |
| Hugging Face Transformers Library | Alternative API for loading and using ESM models, often integrated into modern ML pipelines. |
| AlphaFold2 or ESMFold | Structure prediction tools used to validate or provide structural context for sequences flagged by ESM as high-potential but novel. |
| Pandas & NumPy | For managing, processing, and analyzing large datasets of sequences and their associated model scores (PPL, embeddings). |
| Scikit-learn / PyTorch Lightning | For building downstream regression/classification models on top of ESM embeddings (e.g., predicting stability, function). |
| Biopython | For handling FASTA files, performing sequence alignments, and basic bioinformatics operations. |
Workflow Diagram: ESM-Guided Protein Design Prioritization
Diagram Title: Prioritizing Protein Designs with ESM Pseudo-Perplexity
Troubleshooting Guides and FAQs
FAQ 1: Why is my designed enzyme showing no catalytic activity after expression and purification?
- Possible Causes: Disruption of the active site architecture during design, incorrect folding, or aggregation.
- Troubleshooting Steps:
- Verify the structural integrity of your design. Perform a rapid in silico stability check using Rosetta
ddg_monomeror FoldX. - Check for soluble expression. Run an SDS-PAGE of both soluble and insoluble fractions.
- If insoluble, optimize expression conditions (lower temperature, autoinduction media) or co-express with chaperones.
- If soluble but inactive, verify active site residue geometry (distances, angles) against the native enzyme crystal structure using PyMOL or ChimeraX.
- Consider performing limited proteolysis or circular dichroism (CD) spectroscopy to confirm proper folding.
- Verify the structural integrity of your design. Perform a rapid in silico stability check using Rosetta
FAQ 2: My computational binder design has high predicted affinity but fails to bind in SPR/BLI experiments.
- Possible Causes: Epitope inaccessibility in the native target conformation, energetic frustration in the designed interface, or aggregation of the binder.
- Troubleshooting Steps:
- Ensure the target epitope is solvent-accessible in its physiological oligomerization state. Re-dock your design against a multi-chain structure or a cryo-EM map if available.
- Analyze the designed interface for buried unsatisfied polar atoms using Rosetta HBNet or MolProbity.
- Run a short molecular dynamics (MD) simulation (e.g., 100 ns) to check for rapid destabilization of the binding pose.
- Perform size-exclusion chromatography (SEC) coupled with multi-angle light scattering (SEC-MALS) on the purified binder to check for monodispersity and rule out aggregation.
FAQ 3: How do I balance exploration of novel sequences with the reliability of known scaffolds?
- Thesis Context: This core tension is addressed by hybrid workflows that combine de novo design with functional motif grafting onto stable, proven frameworks.
- Solution: Implement a tiered design protocol. Start with a highly reliable, conserved scaffold for your enzyme or binder (e.g., a TIM barrel, an FN3 scaffold). Use deep learning methods (e.g., ProteinMPNN, RFdiffusion) to generate exploratory sequence variants, but constrain them to maintain the core fold's critical stabilizing residues. Filter these exploratory designs through rigorous physics-based (Rosetta) and learned potential (AlphaFold2 pLDDT) reliability filters before experimental testing.
Experimental Protocols
Protocol 1: In Silico Affinity Maturation of a Designed Binder
Objective: Increase the binding affinity of a computationally designed protein binder through focused sequence exploration. Method:
- Input Structure: Start with the designed binder-target complex.
- Define Designable Regions: Select interfacial residues (within 6Å of the target) for sequence optimization.
- Generate Variants: Use a fixed-backbone sequence design tool (e.g., Rosetta
FastDesign, ProteinMPNN) to propose mutations at designable positions. Generate 10,000-50,000 sequence variants. - Filter for Stability & Affinity: Score all designs using:
- Rosetta
InterfaceAnalyzer(for dG_separated and Interface Score). - AlphaFold2 or AlphaFold-Multimer to predict the complex structure and compute pLDDT and ipTM.
- Rosetta
- Select Top Candidates: Apply multi-parameter filtering (e.g., dG_separated < -15 REU, ipTM > 0.7, no loss of core packing). Select 20-50 designs for experimental testing.
Protocol 2: Functional Validation of a Designed Therapeutic Enzyme
Objective: Characterize the catalytic activity and specificity of a de novo designed enzyme. Method:
- Cloning & Expression: Clone the gene into an appropriate expression vector (e.g., pET series for E. coli). Transform into expression cells.
- Purification: Express protein, lyse cells, and purify via affinity chromatography (His-tag) followed by size-exclusion chromatography (SEC).
- Activity Assay: Set up a reaction mix containing your substrate, appropriate buffer, and purified enzyme. Use a stopped assay or continuous spectroscopic readout (absorbance/fluorescence) to monitor product formation.
- Kinetic Analysis: Vary substrate concentration and fit initial velocity data to the Michaelis-Menten model to derive
k_catandK_M. - Specificity Check: Test against a panel of structurally similar substrates to rule of promiscuous activity.
Table 1: Comparison of Protein Design Software Output Metrics
| Software/Tool | Primary Use | Key Output Metric | Typical Value for a "Good" Design | Computational Cost (GPU/CPU time) |
|---|---|---|---|---|
| Rosetta FastDesign | Sequence design & refinement | Rosetta Energy Units (REU) | Interface dG < -15 REU | High (CPU hours-days) |
| ProteinMPNN | Sequence design | Sequence Recovery / Perplexity | Low perplexity (< 5.0) | Low (GPU minutes) |
| RFdiffusion | De novo backbone generation | pLDDT (predicted) | > 80 | High (GPU hours) |
| AlphaFold2 | Structure prediction | pLDDT & pTM | pLDDT > 80, pTM > 0.7 | Medium (GPU minutes-hours) |
| ESMFold | Structure from sequence | pLDDT | > 70 | Low (GPU minutes) |
Table 2: Experimental Validation Success Rates (Hypothetical Benchmark)
| Design Strategy | Phase | Number of Designs Tested | Success Criterion | Success Rate (%) | Notes |
|---|---|---|---|---|---|
| Pure De Novo (Exploration) | Expression & Solubility | 100 | Soluble, monomeric | ~15% | High failure rate due to folding |
| Grafted Motifs (Balanced) | Expression & Solubility | 100 | Soluble, monomeric | ~65% | Reliable scaffold improves yield |
| Grafted Motifs (Balanced) | Functional Activity | 20 | Measurable binding/activity | ~30% | Functional success requires precise grafting |
| Affinity Maturation (Reliability) | Binding Affinity | 50 | >10x affinity improvement | ~10% | Focused search on known binder |
Workflow and Pathway Diagrams
Title: Balancing Exploration and Reliability in Protein Design Workflow
Title: Computational Affinity Maturation Pipeline
The Scientist's Toolkit: Research Reagent Solutions
| Item | Function in Therapeutic Protein Design | Example Product/Kit |
|---|---|---|
| High-Fidelity DNA Polymerase | Error-free amplification of designed gene sequences for cloning. | Q5 High-Fidelity DNA Polymerase (NEB) |
| Gibson Assembly Master Mix | Seamless, efficient cloning of multiple DNA fragments (e.g., gene into expression vector). | Gibson Assembly HiFi Master Mix (NEB) |
| Competent E. coli Cells | High-efficiency transformation for library cloning and protein expression. | NEB Stable Competent E. coli, BL21(DE3) |
| Affinity Purification Resin | Rapid, specific purification of tagged recombinant proteins. | Ni-NTA Agarose (QIAGEN), HisTrap HP columns (Cytiva) |
| Size-Exclusion Chromatography Column | Polishing step to separate monomeric protein from aggregates or fragments. | Superdex 75 Increase (Cytiva) |
| Surface Plasmon Resonance (SPR) Chip | Label-free, quantitative measurement of binding kinetics (KD, kon, koff). | Series S Sensor Chip CMS (Cytiva) |
| Fluorogenic/Chromogenic Substrate | Sensitive detection of enzymatic activity for kinetic characterization. | Varied by enzyme class (e.g., from Sigma-Aldrich, Thermo Fisher) |
| Stability Assay Kit | Assessment of protein thermal stability (Tm), a proxy for foldedness and aggregation resistance. | Protein Thermal Shift Dye Kit (Thermo Fisher) |
Overcoming Pitfalls: Troubleshooting Unstable or Non-Functional Designs
Troubleshooting Guides & FAQs
Q1: My purified protein shows high turbidity and precipitates during storage. What tests can confirm aggregation as the primary failure mode? A: This is a classic sign of aggregation. Perform the following diagnostic cascade:
- Dynamic Light Scattering (DLS): Measure the hydrodynamic radius. A polydisperse sample with large species (>100 nm) indicates aggregation.
- Size-Exclusion Chromatography (SEC): Compare the elution profile to a monomeric standard. A prominent peak at the void volume confirms large aggregates.
- Static Light Scattering (SLS) or SEC-MALS: Quantify the absolute molecular weight to distinguish between oligomers and larger aggregates.
Table 1: Quantitative Metrics for Aggregation Diagnosis
| Assay | Key Metric | Normal Range (Monomer) | Aggregation Indicator |
|---|---|---|---|
| DLS | Polydispersity Index (PDI) | PDI < 0.2 | PDI > 0.3, large size peak |
| SEC | Elution Volume (Ve) | Consistent with standard | Peak at column void volume (V0) |
| SEC-MALS | Absolute Mw (kDa) | ~Expected sequence mass | Mw >> Expected mass |
Protocol: Diagnostic SEC-MALS
- Equilibrate an analytical-grade SEC column (e.g., Superdex 200 Increase) with filtered/degassed buffer (e.g., PBS, 20 mM Tris, 150 mM NaCl).
- Calibrate the connected MALS (Multi-Angle Light Scattering) and dRI (differential Refractive Index) detectors according to manufacturer specs.
- Inject 50-100 µL of purified protein sample (0.5-2 mg/mL).
- Analyze data using ASTRA or equivalent software. The weight-average molar mass (Mw) across the peak is calculated directly from light scattering, independent of elution volume.
Q2: How can I differentiate between misfolding and loss of active site integrity? Both lead to loss of function. A: These are distinct failure modes requiring different assays. Misfolding is a global structural defect, while loss of active site integrity can occur in an otherwise folded protein.
Table 2: Differentiating Misfolding vs. Active Site Defects
| Assay | Probes | Result if Misfolded | Result if Active Site Defect Only |
|---|---|---|---|
| Circular Dichroism (CD) | Secondary/tertiary structure | Spectrum deviates wildly from reference | Spectrum may match folded reference |
| Differential Scanning Fluorimetry (DSF) | Thermal stability (Tm) | Significant ΔTm (< 45°C often) | Near-native Tm possible |
| Activity Assay | Substrate turnover | No activity | No activity |
| Ligand Binding (SPR/ITC) | Active site binder | No binding | No or weakened binding |
| Protease Sensitivity | Limited proteolysis | Rapid, non-native cleavage pattern | Native-like resistance pattern |
Protocol: Differential Scanning Fluorimetry (Thermal Shift)
- Prepare a master mix of protein (final conc. 1-5 µM) and a fluorescent dye (e.g., SYPRO Orange, 5X final) in assay buffer.
- Aliquot 20 µL into each well of a 96-well PCR plate. Include buffer-only controls.
- Run a thermal ramp from 25°C to 95°C at a rate of 1°C/min in a real-time PCR machine, monitoring fluorescence.
- Analyze the melt curve derivative to determine the protein's melting temperature (Tm). A ≥5°C decrease from a stable reference suggests destabilization/misfolding.
Q3: What experimental strategies can "rescue" a misfolded or aggregating variant identified in exploration? A: This is the critical pivot from exploration to reliability engineering. Implement a rescue workflow.
Diagram Title: Rescue Workflow for Protein Design Failure Modes
Q4: What are the most critical reagents for troubleshooting these failure modes? A: The Scientist's Toolkit - Research Reagent Solutions
| Reagent / Material | Primary Function in Diagnosis/Rescue |
|---|---|
| SEC-MALS System | Gold standard for quantifying aggregation state and absolute molecular weight in solution. |
| SYPRO Orange Dye | Environment-sensitive fluorescent dye for DSF, reporting on protein thermal unfolding. |
| Analytical SEC Columns (e.g., Superdex, Enrich) | High-resolution separation of monomers from oligomers and aggregates. |
| Chaotropic Agents (Urea, GdnHCl) | For generating unfolding curves (CD, fluorescence) to assess global stability. |
| Chemical Chaperones (e.g., Betaine, Proline, TMAO) | Additives to test for stabilization and suppression of aggregation in buffers. |
| Protease Cocktails (Trypsin, Thermolysin, Proteinase K) | For limited proteolysis assays to probe folding integrity and flexibility. |
| Site-Specific Activity Assay Kits | Quantify loss of catalytic function (e.g., hydrolysis, phosphorylation). |
| Surface Plasmon Resonance (SPR) Chip | Immobilize ligands to measure binding kinetics of designed variants. |
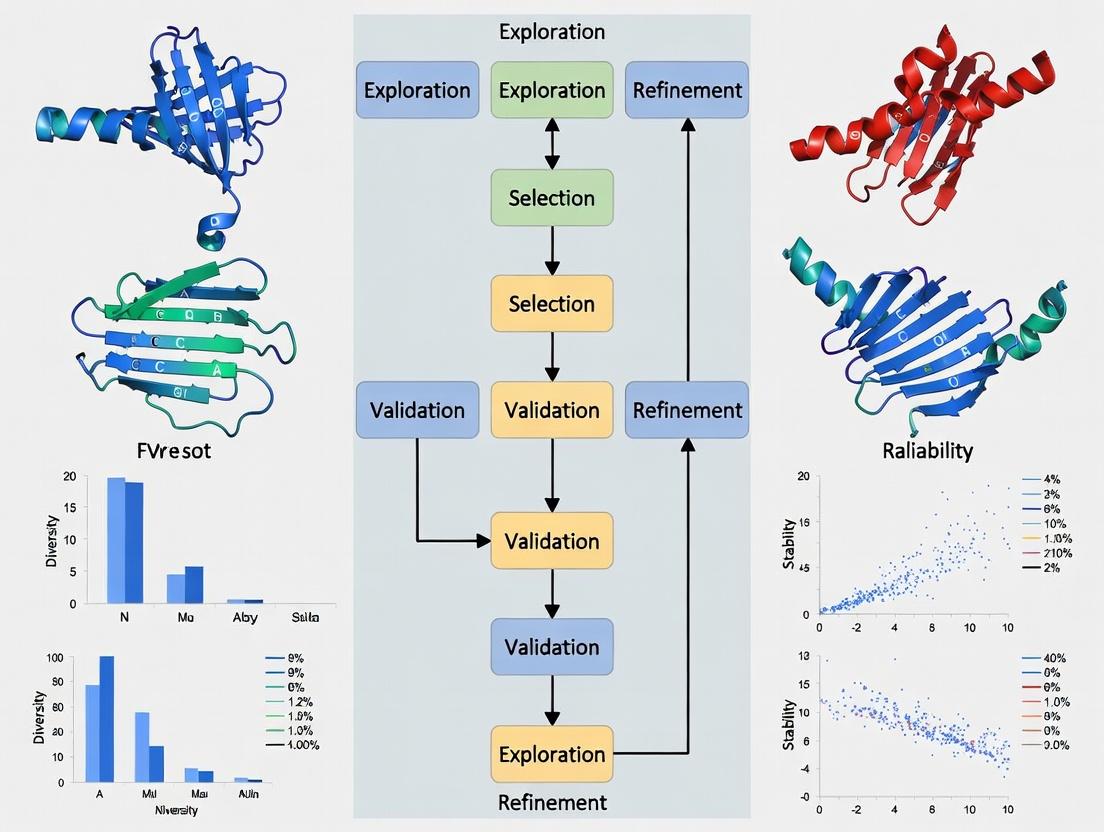
Diagram Title: Protein Design Cycle: From Exploration to Reliable Design
Technical Support Center: Troubleshooting Guides & FAQs
FAQ: Understanding & Applying Core Parameters
Q1: What is the practical effect of the 'temperature' parameter in my protein sequence generation model? Why does a high temperature sometimes produce non-functional or non-physical sequences? A1: Temperature (T) controls the stochasticity of the probability distribution during sequence generation (e.g., in autoregressive or diffusion models). A lower T (e.g., 0.1-0.5) makes the model more deterministic, favoring high-probability (likely reliable) amino acids. A higher T (e.g., 1.0-1.5) flattens the distribution, increasing exploration of lower-probability residues. Non-functional sequences at high T occur because the model excessively explores low-likelihood regions of sequence space, which may violate physical constraints (e.g., improper hydrophobicity, charge clashes). For initial exploration in a new design space, a moderate T (~0.8) is recommended, followed by refinement at lower T.
Q2: When should I use diversity penalties (like repetitionpenalty or frequencypenalty), and how do I set them to avoid repetitive motifs without destroying signal?
A2: Diversity penalties are crucial when your model gets stuck in loops, generating repetitive subsequences (e.g., "AAAGGG..."). This often indicates over-exploitation of a local peak. Use repetition_penalty (applied to tokens already in the sequence) or frequency_penalty (applied based on overall token frequency). Start with low values (1.1-1.3 for repetitionpenalty; 0.1-0.5 for frequencypenalty). Excessive penalties can cause the model to avoid important, functionally required repeats (like coiled-coil heptad repeats). Monitor the per-position entropy of your generated batch.
Q3: How do I balance 'conditioning strength' when using a guide model or classifier for specific protein properties (e.g., foldability, binding affinity)? A3: Conditioning strength (often a scalar weight, ω) determines how strongly the generation process is biased toward the conditioner's signal. Too low (ω<1): the conditioning signal is ignored. Too high (ω>10): sequence diversity collapses, and quality can degrade (posterior collapse). Protocol: Perform a sweep from ω=1 to ω=20, generate 100 sequences per step, and plot the trade-off between the conditioned property (e.g., predicted affinity) and sequence diversity (measured by pairwise Hamming distance). The optimal ω is typically where the property score plateaus but diversity is still >30% of unconstrained levels.
Troubleshooting Guide: Common Experimental Issues
Issue: Model generates plausible-looking sequences, but all experimental assays (expression, stability) fail.
- Check 1: Temperature Calibration. Your T may be too high, exploring unrealistic spaces. Re-generate with T=0.3-0.6 and re-evaluate in silico with an independent folding predictor (e.g., AlphaFold2 pLDDT or Rosetta energy).
- Check 2: Conditioning Conflict. If using multiple conditioners (e.g., for stability + binding), their gradients may conflict, driving sequences to non-natural compromises. Decouple the problem: first generate for stability, then fine-tune for binding.
- Actionable Protocol: Run the "Reliability Funnel" protocol.
- Generate 1000 sequences at your standard parameters.
- Filter through a stringent in silico biophysics pipeline (see table below).
- Cluster the survivors by sequence similarity.
- Manually inspect top clusters for known stabilizing motifs or concerning patterns.
Issue: Model output lacks diversity; all suggestions are minor variants of a single sequence.
- Check 1: Diversity Penalty Inactive/Too Low. Increase
frequency_penaltyincrementally by 0.2 until intra-batch diversity improves. - Check 2: Conditioning Strength Too High. High ω strongly focuses sampling on a narrow peak. Reduce ω by 50%.
- Check 3: Input Prompt Encoding. The initial prompt or seed may be overly restrictive. Try truncating or varying the initial context.
- Actionable Protocol: Implement "Controlled Exploration".
- Start a generation with T=1.0, repetition_penalty=1.2.
- For each of the next
nsteps, reduce T by(0.8/n). - This anneals the sampling, exploring broadly first then refining.
Issue: Conditional generation produces sequences with the desired property but poor scores on auxiliary, non-conditioned properties (e.g., high immunogenicity risk).
- Root Cause: The guide model is myopic, optimizing only its target. You need multi-objective optimization.
- Solution: Implement a combined conditioning signal. If guide scores are
G_targetandG_auxiliary(where higher is better for both), use a weighted sum:G_combined = ω1 * G_target + ω2 * G_auxiliary. Start with ω1:ω2 ratio of 4:1. Alternatively, use a rejection sampling protocol: generate with only the primary conditioner, then filter top candidates with the auxiliary model.
Data Presentation: Parameter Benchmarks in Protein Design
Table 1: Effect of Temperature (T) on Sequence Generation Metrics (Representative Experiment)
| Temperature (T) | Avg. pLDDT (↑) | Seq. Diversity (↑) | % Passing in silico Filters | Recommended Use Case |
|---|---|---|---|---|
| 0.3 | 82.5 | 15.2 | 85% | High-fidelity refinement |
| 0.6 | 80.1 | 28.7 | 72% | Balanced design |
| 0.9 | 76.4 | 45.3 | 51% | Broad exploration |
| 1.2 | 71.8 | 58.9 | 22% | High-risk exploration |
Table 2: Interaction of Conditioning Strength (ω) & Diversity Penalty (freq_penalty)
| ω (Strength) | freq_penalty | Conditioned Property Score (↑) | Pairwise Hamming Distance (↑) | Outcome Description |
|---|---|---|---|---|
| 5 | 0 | 0.85 | 12.1 | High score, low diversity |
| 5 | 0.5 | 0.82 | 24.5 | Good balance |
| 10 | 0 | 0.88 | 5.3 | Over-focused, repetitive |
| 10 | 1.0 | 0.80 | 30.2 | Maintained diversity, good score |
Experimental Protocols
Protocol 1: Systematic Parameter Grid Search for New Design Tasks
- Define Objectives: Primary (e.g., fold confidence) and Secondary (e.g., diversity).
- Set Grid: T = [0.3, 0.6, 0.9, 1.2]; ω = [2, 5, 10]; freq_penalty = [0.0, 0.3, 0.7].
- Generate & Evaluate: For each combination (27 total), generate 50 sequences. Calculate metrics: Avg. primary score, pairwise diversity, % passing basic filters.
- Plot & Select: Create a 3D scatter plot (T, ω, penalty) colored by a composite metric (e.g., 0.7primary + 0.3diversity). Select the Pareto-optimal front for validation.
Protocol 2: Calibrating Conditioner Strength via Ramped Generation
- Ramp ω: For a fixed T and penalty, run 5 sequential batches. For batch
i(0-indexed), use ωi = ωbase * (1.5^i). (e.g., 2, 3, 4.5, 6.75, 10.125). - Track Metrics: For each batch, record the mean conditioner score and the standard deviation of the sequences (a diversity proxy).
- Identify Knee Point: The optimal ω is often at the "knee" of the score-diversity curve, where score gains diminish relative to diversity loss. Fit curves and calculate the point of maximum curvature.
Mandatory Visualization
Title: Parameter Calibration Workflow for Reliable Protein Design
Title: Multi-Objective Conditioning with Strength Weights (ω)
The Scientist's Toolkit: Research Reagent Solutions
Table 3: Essential In Silico Tools for Parameter Calibration Experiments
| Tool / Reagent | Function in Calibration | Key Parameter / Use Note |
|---|---|---|
| Protein Language Model (e.g., ESM-2, ProtGPT2) | Core generative engine. | Temperature (T): Directly accessible in most APIs. |
| Guide Predictor / Classifier (e.g., CNN scoring stability, pLDDT) | Provides signal for conditional generation. | Conditioning Strength (ω): Weight applied to classifier's gradient during sampling. |
| Diversity Penalty Module | Penalizes repetition within a generated sequence. | repetitionpenalty, frequencypenalty: Applied in the logit space before sampling. |
| Sequence Analysis Pipeline (e.g., Biopython, custom scripts) | Calculates metrics like pairwise Hamming distance, entropy. | Used to evaluate output of parameter sweeps. |
| In Silico Validation Suite (AlphaFold2, Rosetta, Aggrescan3D) | Filters sequences for realistic biophysical properties. | Provides pass/fail rates for different parameter sets. |
| Visualization Dashboard (e.g., TensorBoard, custom plots) | Tracks multi-dimensional parameter vs. metric relationships. | Critical for identifying Pareto-optimal settings. |
Technical Support Center: Troubleshooting & FAQs
This support center addresses common issues encountered when implementing iterative refinement loops for protein sequence design. The guidance is framed within the thesis context of balancing the exploration of novel sequence space with the reliability of generating functional, stable proteins.
Frequently Asked Questions (FAQs)
Q1: After the first retraining cycle, my model's predictions are more conservative and show reduced sequence diversity. Is this normal? A: Yes, this is a common challenge when balancing exploration and reliability. The initial model, trained on natural sequences, has inherent diversity. The first round of experimental feedback often highlights failures from overly ambitious designs, causing the retrained model to penalize exploration. To mitigate this, adjust your loss function to include a diversity regularization term that rewards sequence variation within safe functional boundaries. Additionally, maintain a portion of your training data as "exploratory seeds" from the previous cycle.
Q2: My wet-lab experimental validation throughput is low. How can I generate meaningful feedback for retraining with limited data? A: Implement a tiered validation strategy. Use high-throughput in silico assays (folding simulations, stability predictors) to filter thousands of designs down to a few hundred. Then, employ medium-throughput biophysical assays (e.g., thermal shift assays, solubility screens) on this subset. Reserve low-throughput, high-fidelity functional assays (e.g., enzymatic activity, binding affinity) for the top 24-48 designs. This pyramid approach ensures each retraining cycle is informed by data of varying depth and breadth, optimizing for limited experimental resources.
Q3: How do I prevent feedback loops from amplifying biases in my initial training data? A: Actively curate your feedback dataset. Create a bias audit table for each cycle:
| Bias Type | Detection Method | Corrective Action |
|---|---|---|
| Over-representation of stable, inactive variants | Cluster analysis showing loss of functional motifs. | Re-weight training samples to boost functional designs; include negative examples from literature. |
| Experimental noise dominating signal | Poor correlation between predicted and measured values for repeated controls. | Implement statistical filters; require replicate agreement for a datapoint to enter the training set. |
| Path dependence (model gets stuck) | Sequential cycles show minimal improvement in objective metrics. | Introduce a "memory" of past promising directions or occasionally retrain from scratch with a combined dataset. |
Q4: The computational cost of retraining a large neural network every cycle is prohibitive. Are there efficient alternatives? A: Yes. Consider these protocols:
- Transfer Learning / Fine-tuning: Freeze the early layers of your network (which may capture general protein features) and only retrain the final layers on new experimental data.
- Ensemble of Small Models: Train multiple smaller, specialized models instead of one large one. Retrain only the underperforming members each cycle.
- Active Learning Pool: Train your model on a large pool of unlabeled designed sequences. Use an acquisition function (e.g., uncertainty sampling) to select only the most informative 100-200 sequences for experimental testing per cycle, maximizing feedback impact.
Q5: How do I quantify the "reliability" versus "exploration" trade-off in my loop's output? A: Define and track these key metrics in a table for each design cycle:
| Metric Category | Specific Metric | Target (Example) | Purpose |
|---|---|---|---|
| Exploration | Sequence Diversity (Mean Hamming Distance from natural family) | 15-25% | Measures deviation from known safe sequences. |
| Exploration | Novel Motif Incorporation | ≥1 novel functional sub-sequence per 10 designs | Tracks introduction of designed functional elements. |
| Reliability | In Silico Stability Score (e.g., ΔΔG FoldX) | ≤ 2.0 kcal/mol | Predicts structural integrity. |
| Reliability | Experimental Success Rate (passes QC) | ≥ 40% | Core feedback metric on real-world performance. |
| Balance | Pareto Front Analysis | Plotting exploration vs. reliability metrics to find optimal frontier. | Identifies the best compromise designs. |
Experimental Protocols for Key Feedback Experiments
Protocol 1: Medium-Throughput Protein Solubility & Stability Screen
- Objective: Provide quantitative stability data for hundreds of variants to feed the model.
- Method: Express designed sequences in a 96-well plate format using a cell-free system or bacterial culture. Lyse cells and clarify.
- Solubility Assay: Take lysate, separate soluble and insoluble fractions by centrifugation. Analyze soluble fraction by SDS-PAGE or a fluorescence-based total protein stain.
- Thermal Shift Assay: Add a fluorescent dye (e.g., SYPRO Orange) to the soluble fraction. Use a real-time PCR machine to ramp temperature from 25°C to 95°C. Record the melting temperature (Tm) as the midpoint of the protein unfolding transition.
- Data for Model: Use normalized solubility yield and Tm as continuous labels for training. Variants with low solubility (<20% of control) or very low Tm (<40°C) are clear failure labels.
Protocol 2: High-Confidence Functional Validation
- Objective: Generate high-fidelity activity data for top candidates to anchor the model's functional predictions.
- Method: Purify a subset (24-48) of designs using affinity chromatography. Characterize using:
- Surface Plasmon Resonance (SPR): For binding designs, measure association/dissociation kinetics (ka, kd) and equilibrium binding affinity (KD).
- Enzymatic Assay: For enzyme designs, measure Michaelis-Menten constants (Km, kcat) under standardized conditions.
- Data for Model: Use KD or kcat/Km as precise regression targets. This high-quality data corrects the model's functional predictions and should be weighted heavily in the loss function.
Visualizations
Diagram 1: Core Iterative Refinement Loop Workflow
Diagram 2: Model Retraining with Feedback & Regularization
The Scientist's Toolkit: Research Reagent Solutions
| Item | Function in Iterative Refinement | Key Consideration |
|---|---|---|
| Cell-Free Protein Synthesis Kit | Enables rapid, high-throughput expression of hundreds of designed variants, bypassing cell viability constraints. | Essential for testing unstable or potentially toxic designs in early cycles. |
| Fluorescent Dye for Thermal Shift Assay | Reports protein unfolding, providing a quantitative stability metric (Tm) for medium-throughput feedback. | Choose a dye compatible with your expression buffer and plate reader. |
| Next-Generation Sequencing (NGS) Service | For deep mutational scanning (DMS) experiments. Provides fitness data for thousands of variants in parallel, massively enriching feedback data. | Crucial for building comprehensive sequence-function landscapes in later cycles. |
| Automated Liquid Handling System | Executes cloning, transformation, and assay setup for 96/384-well plates, ensuring reproducibility and scale. | Reduces manual error in feedback data generation. |
| GPU Computing Cluster Access | Accelerates model training and in silico variant scoring, reducing cycle time from months to weeks. | Necessary for handling large neural network architectures. |
| Stable, Fluorescent-Labeled Binding Partner | For functional screens (e.g., via flow cytometry or SPR). Provides a reliable benchmark for measuring designed protein affinity. | Quality and consistency are paramount for generating reliable feedback. |
Technical Support Center
Frequently Asked Questions (FAQs)
Q1: My designed protein shows high computational stability but aggregates during expression. What are the first steps to rescue it? A: This often indicates exposed hydrophobic patches or unsatisfied polar residues. First, run computational analyses (using tools like FoldX, Rosetta ddg_monomer, or AlphaFold2) to identify potential aggregation-prone regions. Implement strategic backbone grafting: transplant the problematic functional motif onto a stable, homologously folded scaffold protein. Follow with consensus sequence stabilization on the grafted regions to improve compatibility.
Q2: How do I choose between backbone grafting and consensus stabilization for a failing design? A: Use this decision framework:
| Symptom | Primary Rescue Strategy | Rationale |
|---|---|---|
| Core catalytic site is unstable | Backbone Grafting | Preserves precise active site geometry by placing it in a proven stable fold. |
| Overall fold is correct but Tm is low (<45°C) | Consensus Stabilization | Improves global stability by integrating prevalent amino acids from an aligned family. |
| Chimeric protein with domain interface failures | Grafting + Consensus | Graft domains individually onto stable scaffolds, then use consensus to optimize the linker/junction. |
Q3: What is the critical threshold for consensus percentage in stabilization experiments? A: Research indicates a non-linear relationship. The table below summarizes key stabilization outcomes based on alignment depth and percentage threshold:
| Alignment Depth (# of Sequences) | Consensus Threshold | Typical ΔTm Gain | Risk of Function Loss |
|---|---|---|---|
| 50-100 | >70% | +2 to +5°C | Low |
| 100-500 | >60% | +5 to +10°C | Moderate |
| >500 | >50% | +8 to +15°C | High (over-stabilization) |
Q4: During backbone grafting, how do I handle loop regions between the graft and scaffold? A: Loops are critical. Use this protocol:
- Extract: Define the graft insertion point and extract the scaffold's native loop regions ± 3 residues.
- Analyze: Calculate loop torsion (phi/psi) angles and sequence length variability from the scaffold's homologs.
- Design: Use a de novo loop modeling tool (e.g., Rosetta loop modeling, Chimaera) to sample conformations, guided by the scaffold's native loop statistics. Prioritize sequences that match the scaffold's consensus.
- Filter: Select designs with lowest calculated RMSD and solvation energy.
Experimental Protocol: Consensus Stabilization Workflow
Objective: Increase the thermal stability (Tm) of a designed protein variant by incorporating consensus amino acids.
Materials:
- Target protein sequence.
- Multiple Sequence Alignment (MSA) tool (e.g., ClustalOmega, MAFFT).
- Protein expression and purification system.
- Differential Scanning Fluorimetry (DSF) instrument.
Methodology:
- Generate MSA: Collect homologous sequences (min. 100) from UniRef90 using HHblits or JackHMMER.
- Calculate Consensus: At each position, compute the frequency of each amino acid. Define the consensus residue as the most frequent with a threshold (e.g., >60%).
- Design Variants: Create a series of variants where you mutate non-consensus residues in your design to the consensus, focusing first on buried/core positions.
- Screen: Express and purify variants in a 96-well format. Perform DSF (using SYPRO Orange dye) to measure Tm shifts.
- Validate: For top candidates (ΔTm > +5°C), determine full thermal denaturation profiles via Circular Dichroism (CD) spectroscopy and assay functional activity.
Experimental Protocol: Strategic Backbone Grafting
Objective: Transplant a functional motif from a destabilized design into a stable, structurally homologous scaffold.
Materials:
- High-resolution structures of the Donor (motif) and Scaffold (PDB files).
- Structural alignment software (PyMOL, ChimeraX).
- Protein design suite (Rosetta, PyRosetta).
Methodology:
- Structural Alignment: Superimpose the backbone atoms of the donor motif (e.g., 5-15 residue active site) onto the corresponding secondary structure elements in the scaffold protein. Target RMSD < 1.0 Å.
- Grafting In Silico: Replace the scaffold's residues with the donor's sequence at the aligned positions. Use a "soft" repacking algorithm to minimize clashes in the surrounding shell (8Å).
- Interface Design: Focus computational design on the graft-scaffold interface and loop regions. Use a combined energy function (faatr, farep, hbond_sc, etc.) to optimize packing and hydrogen bonding.
- Filter and Select: Filter designs based on:
- Rosetta total score < target energy.
- Interface ΔΔG (binding energy) < -5 REU.
- No new buried unsatisfied polar atoms.
- Experimental Testing: Proceed with expression, purification, structural validation (via SEC-MALS, NMR), and functional assays.
Visualizations
Decision Workflow for Design Rescue
Consensus Stabilization Protocol Flow
The Scientist's Toolkit: Research Reagent Solutions
| Reagent / Tool | Function in Rescue Operations |
|---|---|
| Rosetta Software Suite | Primary computational engine for energy scoring, ΔΔG calculation, and in silico mutagenesis during grafting and consensus design. |
| SYPRO Orange Dye | Fluorescent dye used in Differential Scanning Fluorimetry (DSF) for high-throughput thermal stability (Tm) measurement of rescue variants. |
| Ni-NTA Agarose Resin | Standard affinity purification resin for His-tagged protein variants, enabling rapid parallel purification during screening. |
| Site-Directed Mutagenesis Kit (e.g., NEB Q5) | Enables rapid construction of consensus mutation libraries and grafting junction variants for testing. |
| Size Exclusion Chromatography Column (e.g., Superdex 75) | Assesses monodispersity and aggregation state post-rescue; critical for validating grafted chimeras. |
| Homology Detection Tool (HHblits/JackHMMER) | Generates deep, sensitive Multiple Sequence Alignments (MSAs) essential for meaningful consensus calculation. |
| Differential Scanning Calorimetry (DSC) Instrument | Provides gold-standard, label-free measurement of thermal unfolding thermodynamics post-rescue. |
Managing Computational Cost vs. Experimental Validation Throughput
Technical Support Center
Troubleshooting Guides & FAQs
Q1: Our lab is experiencing a severe bottleneck. Our computational pipeline generates thousands of promising protein designs per week, but we can only afford to experimentally validate a few dozen. How can we prioritize which designs to test? A: This is the core challenge. Implement a multi-fidelity filtering pipeline.
- Initial Filter (High Throughput, Low Cost): Apply rigorous computational stability and solubility predictors (e.g., AlphaFold2 for structure, Aggrescan3D). Discard designs with poor scores.
- Secondary Filter (Medium Throughput, Moderate Cost): Use more expensive but informative simulations, such as short-run molecular dynamics (MD) to assess local flexibility and residue interaction networks.
- Tertiary Filter (Low Throughput, High Cost): Reserve for top candidates. Perform free energy perturbation (FEP) calculations or long-timescale MD on specific functional regions. Prioritize designs that consistently rank in the top percentile across all filters, with particular emphasis on novelty and functional site integrity.
Q2: We rely on AlphaFold2 for structure prediction, but the computational cost for large batches is prohibitive. Are there effective strategies to reduce runtime? A: Yes, employ a tiered prediction strategy.
- For Initial Screening: Use faster, less accurate models like ESMFold or OmegaFold for initial sequence-structure assessment. They offer a good balance of speed and accuracy.
- For Top Candidates Only: Use AlphaFold2 or AlphaFold3 with multiple sequence alignment (MSA) generation. To save costs here:
- Use a pre-computed MSA database (like the one from the AlphaFold DB) if available for your template sequences.
- Limit the number of recycles (
--num-recycle=3is often sufficient for stable designs). - Use the AlphaFold2-Lite or similar distilled models where appropriate.
Q3: Our experimental validation (e.g., SPR binding assays) frequently fails due to protein expression or solubility issues, wasting weeks of work. How can computational tools better predict this? A: Integrate expression and solubility predictors early in your workflow.
- Sequence-Based Tools: Use tools like SoluProt, DeepSol, or CamSol to predict intrinsic solubility from sequence.
- Structure-Based Tools: Use FoldX (CalculateStability command) or Rosetta (ddG_monomer) to computationally assess folding energy. Designs with high ΔΔG are risky.
- Codon Optimization: Always use a codon optimization tool tailored to your expression system (e.g., E. coli, HEK293) after the functional design is complete to avoid disrupting functional motifs.
Q4: How do we balance exploring novel, high-risk protein folds (exploration) against optimizing known, stable scaffolds (exploitation) within a limited budget? A: Allocate your computational and experimental resources strategically using a predefined ratio (e.g., 70% exploitation, 30% exploration).
- Exploitation Pipeline: Focus on known scaffolds with modifications. Use faster computational validation and higher experimental throughput.
- Exploration Pipeline: Allocate separate budget for de novo designs. Accept higher computational cost and lower experimental success rate. Use generative models (RFdiffusion, ProteinMPNN) to create novel backbones, followed by the most stringent stability filters.
Table 1: Comparative Analysis of Protein Structure Prediction Tools
| Tool | Typical Runtime (per design) | Relative Cost (GPU hrs) | Typical pLDDT/Accuracy | Best Use Case |
|---|---|---|---|---|
| AlphaFold2 (w/ MSA) | 30-90 min | 100 (Baseline) | 85-95 | Final validation of top candidates |
| AlphaFold2 (no MSA) | 10-20 min | 30 | 70-85 | Medium-throughput screening |
| ESMFold | 2-10 sec | 1 | 70-85 | Ultra-high-throughput initial screening |
| OmegaFold | 10-30 sec | 5 | 75-88 | Screening when MSA is poor/unavailable |
| RosettaFold | 15-60 min | 40 | 75-90 | Integrating with Rosetta design suite |
Table 2: Experimental vs. Computational Throughput & Cost
| Stage | Method | Weekly Throughput | Approx. Cost per Sample | Success Rate Key Factor |
|---|---|---|---|---|
| Computational Screening | ESMFold + Basic Filters | 10,000+ | ~$0.10 (Cloud) | Sequence quality, filter thresholds |
| Computational Validation | AF2/MD on filtered set | 100-200 | ~$5-$50 | Structural stability, solubility score |
| Experimental Expression | High-throughput E. coli | 500-1000 | $20-$100 | Codon optimization, solubility prediction |
| Experimental Purification | FPLC/ÄKTA | 100-200 | $50-$200 | Stability score (ΔΔG), expression tag |
| Experimental Assay (SPR) | Biacore 8K | 50-100 | $200-$500 | Proper folding, functional site integrity |
Experimental Protocols
Protocol 1: Multi-Stage Computational Filtering for Experimental Prioritization Objective: To systematically reduce a large candidate pool (10,000+) to a manageable number (20-50) for experimental testing.
- Sequence Filtering: Remove sequences with undesirable motifs (e.g., cysteine pairs for disulfides unless desired, protease sites). Use
regexor motif search tools. - Fast Folding & Solubility Prediction: Run entire pool through ESMFold and SoluProt. Discard sequences with mean pLDDT < 70 or solubility score below threshold (e.g., SoluProt score < 0.5).
- High-Quality Folding: Run remaining candidates (200-500) through AlphaFold2 with 3 recycles and no template mode. Discard with pLDDT < 80 or low confidence in core/functional regions.
- Energetic & Dynamic Assessment: For top 100 designs, perform:
- FoldX RepairPDB & Stability: Calculate ΔΔG of folding. Discard designs with ΔΔG > 5 kcal/mol.
- Short MD Simulation (100ns): Assess root-mean-square deviation (RMSD) and root-mean-square fluctuation (RMSF). Discard designs with unstable core (RMSD > 2.5Å) or hyper-flexible functional sites.
- Final Ranking: Rank candidates by a composite score: 0.4(pLDDT) + 0.3(Solubility) + 0.2(1/ΔΔG) + 0.1(1/RMSD).
Protocol 2: High-Throughput Expression and Solubility Test in E. coli Objective: To experimentally validate expression yield and solubility of computationally filtered designs.
- Cloning: Use Golden Gate or Gibson assembly to clone codon-optimized genes into a T7 expression vector (e.g., pET series) with a C-terminal His-tag.
- Expression Test: Transform into BL21(DE3) cells. Inoculate 96 deep-well blocks with 1 mL auto-induction media per well. Grow at 37°C to OD600 ~0.6, then induce at 18°C for 18 hours.
- Solubility Assay: Pellet cells. Lyse using chemical lysis (BugBuster Master Mix) or sonication in blocks. Centrifuge at 4000xg for 20 min to separate soluble (supernatant) and insoluble (pellet) fractions.
- Analysis: Run soluble and insoluble fractions on SDS-PAGE (using a 96-well gel system). Score expression level (total protein) and solubility fraction (soluble/total). Prioritize designs with strong bands in the soluble fraction.
Diagrams
Title: Computational-Experimental Prioritization Funnel
Title: Balancing Exploration and Exploitation Budgets
The Scientist's Toolkit: Research Reagent Solutions
Table 3: Key Reagents for High-Throughput Protein Validation
| Reagent / Material | Function & Rationale |
|---|---|
| Auto-induction Media (e.g., Overnight Express) | Allows high-density growth and automated protein expression in deep-well blocks without manual IPTG induction, critical for screening 100s of constructs. |
| BugBuster HT Protein Extraction Reagent | Chemical lysis formulation for 96-well plates. Faster and more consistent than sonication for parallelized solubility screening. |
| His-Tag Purification Plates (Ni-NTA Magnetic Beads in 96-well) | Enables parallel, small-scale purification of 10s of designs to obtain clean protein for initial biophysical assays (e.g., SEC, DSF). |
| Thermofluor (DSF) Dyes (e.g., SYPRO Orange) | Used in Differential Scanning Fluorimetry to estimate protein thermal stability (Tm) in a 96-well PCR plate format. A rapid proxy for foldedness. |
| Biolayer Interferometry (BLI) Plates (e.g., SA Biosensors) | Enables medium-throughput kinetic binding analysis (kon, koff, KD) without the fluidics of SPR, useful for ranking 10s of designs. |
| Fast-Flow FPLC Columns (e.g., HiLoad Superdex 75pg) | For high-resolution size-exclusion chromatography as a final quality check, removing aggregates and confirming monodispersity before costly assays. |
Benchmarking Success: Validation Strategies and Comparative Analysis of Approaches
Troubleshooting Guides & FAQs
Surface Plasmon Resonance (SPR)
Q1: Our sensorgrams show a high, non-specific binding response. How can we resolve this? A: This is often due to a poorly prepared sensor surface or suboptimal running buffer. First, ensure the flow cells are rigorously regenerated according to the ligand's stability. Implement a more stringent blocking step (e.g., with 1 mg/mL BSA or casein) after ligand immobilization. Optimize the running buffer composition—increase ionic strength (e.g., 150-300 mM NaCl), add a non-ionic detergent (0.05% P20), or include a low percentage of DMSO if working with small molecules. Always include a reference flow cell and an analyte-only injection for subtraction.
Q2: The binding kinetics data (kd, ka) are inconsistent between replicates. A: Inconsistent kinetics typically stem from mass transport limitation or ligand heterogeneity. To check for mass transport, run at multiple flow rates (e.g., 30, 50, 75 µL/min); if the observed binding rate (kon) increases with flow rate, mass transport is interfering—reduce ligand density. Ligand heterogeneity (partial activity, degradation) requires rigorous quality control of the immobilized protein. Ensure thorough analyte serial dilution from a single stock to avoid pipetting errors.
Isothermal Titration Calorimetry (ITC)
Q3: The titration curve shows very small, noisy heat changes, making data interpretation impossible. A: Small heat changes indicate a low binding enthalpy (ΔH). First, increase the concentrations of both ligand and analyte within the instrument's detection limit and cell solubility (often to 100-500 µM). Ensure the buffer in the cell and syringe are perfectly matched by exhaustive dialysis. If the binding entropy-driven, consider switching to a more sensitive instrument (nano-ITC) or an alternative method like SPR. Check and clean the calorimetry cell for contaminants.
Q4: The fitted stoichiometry (N value) is not an integer (e.g., 0.7 or 1.4). A: A non-integer N usually reflects inaccurate concentration determination. Precisely quantify the active concentration of the macromolecule in the cell, using absorbance (A280 with correct extinction coefficient) or quantitative amino acid analysis. Impurities or protein aggregation will also skew N. Analyze protein homogeneity via SDS-PAGE and size-exclusion chromatography prior to the experiment.
Differential Scanning Fluorimetry (DSF)
Q5: The melt curve has multiple inflection points or a very broad transition. A: Multiple transitions suggest a multi-domain protein where domains unfold independently. Analyze the data using a first-derivative plot to identify individual Tm values for each domain. A broad transition can indicate non-cooperative unfolding or protein aggregation. Include a stabilizing buffer (e.g., 100-150 mM NaCl) and consider varying the dye concentration (2X to 10X Sypro Orange). Ensure a homogeneous protein sample.
Q6: The observed Tm shift upon ligand addition is negligible, even for a known binder. A: A negligible shift may occur if the ligand binds with minimal change in protein stability (e.g., purely entropy-driven binding) or if the binding is too weak (Kd > ~100 µM). Try optimizing the assay pH and salt conditions to favor enthalpic contributions. For weak binders, use a competitive format: pre-incubate the protein with a high-affinity, stabilizing ligand that gives a known Tm shift, then titrate your compound to displace it, reducing the Tm.
Functional Activity Screens (e.g., Enzymatic Assays)
Q7: High background signal obscures the activity readout in our screen. A: Systematically identify the source: run controls without enzyme (substrate background) and without substrate (enzyme background). Use a higher purity grade of substrates. If using a coupled assay, optimize the concentrations of coupling enzymes. Increase the stringency of wash steps in plate-based assays. For fluorescent assays, switch to a black plate to reduce cross-talk.
Q8: The Z'-factor for our HTS assay is below 0.5, indicating poor assay quality. A: A low Z'-factor signals high variability or a small dynamic range. First, optimize enzyme and substrate concentrations to maximize the signal-to-background ratio. Ensure reagent homogeneity and consistent temperature using an equilibrated plate reader. Implement automated liquid handling to reduce pipetting variance. Check for compound interference (e.g., fluorescence quenching, absorbance) and apply appropriate corrections.
Table 1: Key Performance Parameters for Biophysical Assays
| Assay | Typical Sample Consumption | Throughput | Key Measured Parameters | Typical Kd Range | Key Advantage |
|---|---|---|---|---|---|
| SPR | ~50-500 µg (ligand) | Medium | ka, kd, Kd, Stoichiometry | 1 µM - 1 pM | Real-time kinetics, label-free |
| ITC | ~500-2000 µg | Low | ΔH, ΔS, ΔG, Kd, N (Stoichiometry) | 1 nM - 100 µM | Direct measurement of thermodynamics |
| DSF | ~1-50 µg | High | Tm, ΔTm | N/A (binding inferred) | Low-cost, high-speed stability screening |
| Functional Screen | Variable (ng-µg) | Very High | IC50, EC50, % Inhibition/Activation | Variable | Direct relevance to biological activity |
Table 2: Common Troubleshooting Indicators & Solutions
| Symptom (Assay) | Likely Cause | Immediate Action | Long-term Fix |
|---|---|---|---|
| High RU drift (SPR) | Buffer mismatch, air bubbles | Degas buffers, match compositions | Implement in-line degasser, better dialysis |
| Positive peaks in control (ITC) | Mismatched buffer/solvent | Dialyze both components together | Use dialysis with shared buffer reservoir |
| No transition (DSF) | Protein unfolded/low conc. | Check protein integrity (SEC, CD) | Optimize expression/purification, add stabilizers |
| Low signal window (Activity) | Substrate depletion, poor detection | Shorten incubation, optimize wavelength | Switch detection method (e.g., luminescence) |
Detailed Experimental Protocols
Protocol 1: SPR for Kinetic Analysis
- Surface Preparation: Activate a CMS sensor chip with a 1:1 mixture of 0.4 M EDC and 0.1 M NHS for 7 minutes.
- Ligand Immobilization: Dilute the ligand to 10-50 µg/mL in 10 mM sodium acetate buffer (pH optimized for ligand's pI). Inject over the activated surface for 5-7 minutes to achieve 50-100 Response Units (RU) for kinetics.
- Blocking: Deactivate excess esters with a 7-minute injection of 1 M ethanolamine-HCl, pH 8.5.
- Kinetic Run: Use HBS-EP+ (10 mM HEPES, 150 mM NaCl, 3 mM EDTA, 0.05% v/v Surfactant P20, pH 7.4) as running buffer. Inject analyte in a 2-fold dilution series (from an estimated 10*Kd to blank) for 2-3 minutes (association), followed by dissociation for 5-10 minutes at a flow rate of 30-50 µL/min.
- Regeneration: Identify a 30-60 second pulse of regeneration buffer (e.g., 10 mM glycine pH 2.0-3.0) that removes analyte without damaging ligand.
- Analysis: Double-reference the data (reference flow cell & blank injection). Fit to a 1:1 Langmuir binding model.
Protocol 2: ITC for Binding Thermodynamics
- Buffer Matching: Dialyze both the protein (cell) and ligand (syringe) exhaustively against the same batch of buffer (e.g., PBS, pH 7.4). After dialysis, centrifuge to remove aggregates.
- Sample Loading: Degas all solutions for 10 minutes. Load the protein into the sample cell (typical concentration 10-100 µM). Load the ligand into the syringe at a concentration 10-20 times higher than the protein.
- Titration Setup: Set the instrument temperature (typically 25°C). Program a titration of 19 injections (first injection 0.5 µL, subsequent 2-2.5 µL) with 150-180 seconds spacing between injections.
- Data Collection & Analysis: Run the experiment with constant stirring. Integrate the raw heat peaks, subtract the heat of dilution (from titrating ligand into buffer), and fit the binding isotherm to a single-site binding model to derive ΔH, Kd, and N.
Protocol 3: DSF for Protein Thermal Stability
- Sample Preparation: Prepare a master mix containing 5 µM protein, 5-10X SYPRO Orange dye, and assay buffer (e.g., 50 mM HEPES, 100 mM NaCl, pH 7.5). For ligand testing, add compound at desired concentration (e.g., 100 µM).
- Plate Setup: Aliquot 20 µL of each sample into a clear or white 96-well PCR plate. Seal the plate with an optical film. Centrifuge briefly.
- Run Thermal Ramp: Use a real-time PCR instrument. Set the temperature ramp from 20°C to 95°C with a gradual increment (e.g., 1°C/min) while monitoring fluorescence (ROX or FITC channel).
- Data Analysis: Plot raw fluorescence vs. temperature. Calculate the first derivative to determine the Tm (temperature at the inflection point). The ligand-induced stability change is ΔTm = Tm(protein+ligand) - Tm(protein alone).
The Scientist's Toolkit: Research Reagent Solutions
| Item | Function & Application |
|---|---|
| CMS Sensor Chip (SPR) | Carboxymethylated dextran matrix for covalent amine coupling of ligands. |
| HBS-EP+ Buffer | Standard SPR running buffer; reduces non-specific electrostatic interactions. |
| Sypro Orange Dye (DSF) | Environment-sensitive fluorescent dye that binds hydrophobic patches exposed during protein unfolding. |
| 96-well PCR Plates (DSF) | Optical-grade plates compatible with real-time PCR instruments for high-throughput thermal scans. |
| ITC Cell Cleaning Solution | (e.g., 5% v/v Contrad 70) Removes stubborn protein aggregates and contaminants from the calorimetry cell. |
| Coupled Enzyme System | (e.g., NADH/NADPH-dependent) For monitoring functional activity in continuous kinetic assays. |
| Reference Control Compounds | Known high-affinity binders/inhibitors for positive controls in all assay formats. |
Experimental Workflow & Relationship Diagrams
Title: Gold-Standard Assay Cascade in Protein Design
Title: Troubleshooting Loop in Assay-Driven Research
Technical Support Center: Troubleshooting & FAQs
AlphaFold2/3 Troubleshooting
Q1: AlphaFold3 returns a low pLDDT score (<70) for my designed protein. What does this mean and what should I do next? A: A pLDDT score below 70 indicates low per-residue confidence in the predicted local structure. This is a critical reliability checkpoint in sequence design.
- Actionable Steps:
- Check Input Sequence: Ensure your FASTA sequence contains only standard amino acid codes. Remove any non-canonical residues unless explicitly using AlphaFold3's special capabilities.
- Run Multiple Seeds: Use different random seeds (
--model.seedparameter) to generate 5-10 predictions. High variance between runs suggests an intrinsically disordered region or an unstable fold. - Analyze pLDDT Profile: Use the output JSON/PAE file to identify low-confidence regions. Often, these are terminal or loop regions. Consider redesigning or truncating these specific segments.
- Cross-validate with ESMFold: Run the same sequence through ESMFold for a rapid independent check. Agreement between models increases confidence.
Q2: I am getting a "CUDA out of memory" error when running AlphaFold3, even on a GPU with 16GB VRAM. How can I complete the prediction? A: This is common for large protein complexes or long sequences (>1000 residues).
- Troubleshooting Guide:
- Reduce Model Size: Use the
--model.type=AlphaFold3-ptmflag (if available for your installation) instead of the full complex model. - Enable CPU Offloading: Use runtime flags like
--model.cpu_offload=Trueto move some computations from GPU to system RAM. - Truncate Inputs: If predicting a complex, temporarily predict subunits individually to identify the memory-intensive component.
- Use ColabFold: For single-chain proteins, consider the ColabFold implementation, which is optimized for memory efficiency.
- Reduce Model Size: Use the
Q3: The Predicted Aligned Error (PAE) plot shows high inter-domain error. Is my designed multi-domain protein unreliable? A: A high PAE (>10 Å) between defined domains suggests flexible or ambiguous relative orientation. This is a key finding for dynamics.
- Interpretation & Next Steps:
- This may reflect biological reality (e.g., a hinge region). Consult literature on similar protein architectures.
- It may indicate design instability where domains are not forming stable interactions.
- Protocol for Validation: Proceed to Molecular Dynamics (MD) simulation to determine if the interface is stable over time or samples multiple orientations.
Molecular Dynamics Troubleshooting
Q4: My protein unfolds within the first 100ns of a production MD simulation. Does this invalidate my design? A: Not necessarily. It flags a need for deeper analysis to balance exploration (of conformational space) with reliability (of the designed state).
- Diagnostic Protocol:
- Control Simulation: Run a simulation of a known stable, wild-type protein with the same force field and solvent model. If it also unfolds rapidly, your simulation parameters (e.g., temperature, box size) are at fault.
- Analyze Unfolding Nucleus: Calculate per-residue Root Mean Square Fluctuation (RMSF). Identify the 3-5 residue cluster that unfolds first. This is a hotspot for redesign.
- Check Simulation Metrics:
- Energy Drift: Ensure total energy is stable.
- Pressure/Density: Verify system equilibration.
- Repeat with Restraints: Re-run with mild backbone restraints (1-2 kcal/mol/Ų) on the stable secondary elements identified by AlphaFold. If the rest of the structure now remains folded, targeted loop/interface redesign is needed.
Q5: How do I choose between force fields (e.g., CHARMM36, AMBER ff19SB, OPLS-AA) for simulating a de novo designed protein? A: Force field choice is crucial for reliability. Use this decision table:
| Force Field | Best For | Key Consideration for Design |
|---|---|---|
| CHARMM36m | Membrane proteins, IDPs, long-timescale stability. | Excellent for complex systems; widely validated. |
| AMBER ff19SB | General-purpose, soluble globular proteins. | Good balance of accuracy and speed for initial tests. |
| OPLS-AA/M | Small molecules, ligand binding studies. | Use if your design incorporates non-natural amino acids. |
| DES-Amber (Specialized) | De novo designed proteins & peptides. | Explicitly tuned for designed structures; highly recommended. |
Recommended Protocol: Start with DES-Amber if available. If not, use CHARMM36m for comprehensive validation or AMBER ff19SB for rapid screening.
Q6: My RMSD plateaus but RMSF remains high in specific loops. How should I interpret this for my design's function? A: This describes a common "reliable fold, dynamic loops" scenario, often biologically relevant.
- Analysis Workflow:
- Quantify Flexibility: Calculate and visualize RMSF. Tabulate the top 3 flexible regions.
Loop/Region Avg RMSF (Å) Proposed Function Residues 45-55 3.5 Potential ligand-binding loop. Residues 120-130 2.8 Solvent-exposed linker; may be truncated. - Functional Correlation: Cross-reference high-RMSF loops with:
- AlphaFold's pLDDT (low confidence often correlates with high flexibility).
- Evolutionary data from BLAST or ESM-2 (conserved vs. variable).
- Decision Point: This may not be a "problem" but an exploration opportunity. If designing for catalysis, loop dynamics may be essential. If designing for a rigid scaffold, these loops should be stabilized via mutagenesis (e.g., glycine → proline, introducing disulfide bridges).
- Quantify Flexibility: Calculate and visualize RMSF. Tabulate the top 3 flexible regions.
Experimental Protocols
Protocol 1: Integrated AlphaFold-MD Validation Pipeline Objective: To rigorously validate the stability and dynamics of a computationally designed protein sequence.
- Sequence Input: Provide FASTA sequence (
design.fasta). - Structure Prediction:
- Run AlphaFold3 (or ColabFold) with 5 seeds:
--model.seed=0,1,2,3,4. - Outputs:
ranked_0.pdb,scores.json(contains pLDDT, pTM, PAE).
- Run AlphaFold3 (or ColabFold) with 5 seeds:
- Confidence Analysis:
- Calculate average pLDDT. If >80, proceed.
- Inspect PAE matrix for inter-domain errors <10 Å.
- System Preparation for MD:
- Use
ranked_0.pdbas input. - Solvate in TIP3P water box (buffer ≥10 Å) using
gmx solvateortleap. - Add ions to neutralize charge (0.15 M NaCl).
- Use
- Energy Minimization & Equilibration:
- Minimize: 5000 steps steepest descent.
- NVT equilibration: 100 ps, 298 K (Berendsen thermostat).
- NPT equilibration: 1 ns, 1 bar (Parrinello-Rahman barostat).
- Production MD:
- Run triplicate 250 ns simulations with different velocities.
- Use force field (e.g., DES-Amber/CHARMM36m).
- Analysis:
- Plot backbone RMSD vs. time to assess stability.
- Calculate per-residue RMSF to identify flexible hotspots.
- Compute radius of gyration (Rg) for compactness.
Protocol 2: Troubleshooting Low pLDDT via Iterative Redesign
- Identify Low-Confidence Residues: Extract residues with pLDDT < 60 from AlphaFold output.
- Generate Point Mutants: Use Rosetta
ddg_monomeror ESM-2 to suggest stabilizing point mutations for these positions. - Rapid Re-screening: Submit all mutant sequences to ESMFold (faster than AF) and select top 3 by predicted confidence.
- Full Validation: Run the selected mutants through Protocol 1.
Visualizations
Title: AlphaFold-MD Integrated Validation Workflow
Title: Interpreting PAE for Domain Orientation Reliability
The Scientist's Toolkit: Research Reagent Solutions
| Item | Function in Validation Pipeline | Example/Note |
|---|---|---|
| AlphaFold3 (Local/Cloud) | High-accuracy structure prediction for proteins, complexes, ligands. | Use for final design validation; requires significant GPU resources. |
| ColabFold (Server) | Streamlined, memory-efficient AF2/3 implementation. | Best for rapid screening of multiple designs; access via Google Colab. |
| ESMFold (Server) | Ultra-fast protein structure prediction from language model. | Use for initial triage of thousands of designs (<1 min per structure). |
| GROMACS | High-performance MD simulation software. | Open-source, highly scalable for CPU/GPU clusters. Recommended for production MD. |
| AMBER / OpenMM | Suite for MD simulations & analysis. | AMBER has excellent force fields; OpenMM is highly flexible for custom systems. |
| DES-Amber Force Field | Specialized force field for de novo designed proteins. | Critical for reliable results. Parameterized on designed structures. |
| PyMOL / ChimeraX | Molecular visualization. | Analyze AF outputs, visualize MD trajectories, and create figures. |
| VMD | Visualization & analysis of MD trajectories. | Essential for in-depth trajectory analysis and rendering. |
| BioPython | Python library for sequence/structure manipulation. | Scripting FASTA/PDB processing, automating analysis pipelines. |
| MDanalysis / pytraj | Python libraries for analyzing MD data. | Calculate RMSD, RMSF, distances, etc., from trajectories programmatically. |
This technical support center addresses common challenges faced by researchers navigating the trade-offs between exploration (novelty) and reliability (stability/function) in protein design. The following FAQs and guides are contextualized within this core thesis, providing practical solutions for experiments leveraging the three primary design paradigms.
Troubleshooting Guides & FAQs
Generative AI for Protein Design
Q1: My AI-generated protein sequences express poorly in E. coli. What are the first steps to troubleshoot? A: Poor expression often indicates misfolding or aggregation. Follow this protocol:
- Check Sequence Fundamentals: Use tools like
ToxinPredorDeepToxto screen for hydrophobic patches or amyloidogenic regions introduced by the model. - Reduce Induction Temperature: Shift from 37°C to 18°C post-induction to slow translation and improve folding.
- Fusion Tag Strategy: Subclone the sequence into a vector with a solubility-enhancing fusion tag (e.g., MBP, GST). If expression improves, perform an on-column cleavage trial.
- In-silico Refolding: Use AlphaFold2 or ESMFold to predict the structure of the expressed sequence. Compare it to the designed structure; high pLDDT scores but structural deviation suggest misfolding due to sequence inaccuracies.
Q2: How do I validate that the generative model hasn't created a "hallucination" with no stable fold? A: Implement a multi-scale computational validation workflow before synthesis.
- Step 1 (Stability): Calculate
ddG(change in folding free energy) using Rosettaddg_monomeror a comparable tool. Aim for ddG < 0. - Step 2 (Dynamics): Run a short (50-100 ns) molecular dynamics (MD) simulation using GROMACS or OpenMM. Analyze RMSD and radius of gyration for stability.
- Step 3 (Consensus): Generate multiple sequences for the same scaffold using different models (e.g., ProteinMPNN, RFdiffusion). Synthesize the consensus sequence, which is often more reliable.
Directed Evolution
Q3: My library diversity after error-prone PCR (epPCR) is too low. How can I increase it? A: Low diversity stems from inadequate mutation rate or bias.
- Optimize PCR Conditions: Use the
Mutazyme IIkit, which provides a more random mutation spectrum than traditional Taq. Follow this protocol:- Template DNA: 100 ng.
- MnCl2 concentration: Titrate from 0.1 to 0.5 mM in the reaction buffer. Higher Mn²⁺ increases mutation rate.
- Number of cycles: Limit to 25-30 to avoid dominant wild-type amplification.
- Use DNA Shuffling: Combine fragments from epPCR with wild-type gene via DNase I fragmentation and reassembly PCR to increase sequence space exploration.
- Sequence Verification: Always Sanger-sequence 10-20 clones from your library before selection to empirically determine your mutation rate and randomness.
Q4: During yeast display screening, my target binding signal does not improve over selection rounds. What could be wrong? A: This indicates potential library or screening issues.
- Check 1: Library Quality. Use FACS to analyze the pre-selection library. Ensure >99% of cells express the protein on the surface.
- Check 2: Selection Pressure. The antigen concentration may be too high, preventing differentiation between weak and strong binders. Titrate antigen concentration down by 10-fold each round (e.g., from 100 nM to 1 nM).
- Check 3: Gate Setting. Avoid overly stringent gates in early rounds. Gate on the top 5-10% of the population, not the top 1%.
De novo Physical Design (Rosetta/Physics-based)
Q5: My de novo designed protein aggregates during purification. How can I improve solubility? A: Aggregation is common in de novo designs due to exposed hydrophobic cores.
- Surface Engineering: Use the
Rosetta fixbbprotocol to repack surface residues, replacing hydrophobic residues (Ile, Leu, Val) with polar residues (Ser, Thr, Glu) while maintaining backbone compatibility. - Add Disulfide Bonds: Use
RosettaDisulfideto identify potential backbone positions for disulfide bond formation to stabilize the core and prevent unfolding. - Buffer Optimization: Screen a pH gradient (pH 4.0-9.0) and add arginine (0.5 M) to the lysis buffer to suppress aggregation during purification.
Q6: The experimentally solved structure (via X-ray) of my design deviates significantly from the computational model. What next? A: This is a critical exploration vs. reliability checkpoint.
- Analyze the Deviation: Calculate the Cα RMSD. If >3Å, the fold may be incorrect. If 1.5-3Å, the fold is likely correct but suboptimal.
- Refinement Protocol: Use the experimental density map in a Rosetta
relaxprotocol with constraints. This often identifies side-chain rotamer errors or small loop rearrangements. - Iterative Design: Feed the solved structure back into your design pipeline (e.g.,
RosettaRemodel) to fix the problematic regions, creating a "second-generation" design.
Table 1: Paradigm Comparison for Exploration vs. Reliability
| Aspect | Generative AI | Directed Evolution | De novo Physical Design |
|---|---|---|---|
| Exploration Capacity | Very High (novel folds, scaffolds) | High (local to distal sequence space) | Moderate-High (novel active sites, folds) |
| Theoretical Reliability | Variable (model-dependent) | High (tested in vitro/vivo) | Low-Moderate (force field dependent) |
| Typical Experimental Cycle Time | Weeks (design + synthesis + test) | Months (library build + screening) | Months (design + validation) |
| Primary Failure Mode | Non-expressible "hallucinations" | No improved variants found | Aggregation / incorrect folding |
| Best Suited For | Novel scaffold generation, high-level ideation | Optimizing existing functions (binding, catalysis) | Precise placement of functional residues |
Table 2: Troubleshooting Quick Reference
| Symptom | Likely Cause | First Action (Generative AI) | First Action (Directed Evolution) | First Action (De novo Design) |
|---|---|---|---|---|
| No Protein Expression | Toxic/insoluble sequence | Check for hydrophobic patches; add solubility tag | Verify library diversity & expression vector | Run trRosetta or AF2 to check foldability |
| Protein Expressed but Insoluble | Misfolding/aggregation | Lower induction temperature; screen buffers | N/A (screen soluble fraction) | Introduce surface charged residues; add disulfides |
| Low Functional Activity | Incorrect structure/interface | Validate with MD; refine with ProteinMPNN | Increase selection stringency; use counter-selection | Re-design active site with tighter constraints |
| High Background in Assay | Non-specific binding | Add negative selection in training data | Incorporate off-target in screening wash | Add negative design in Rosetta to repel off-targets |
Experimental Protocols
Protocol 1: Generating and Validating a Generative AI Protein Design
- Input: Target protein structure (PDB) or fold description.
- Design: Use RFdiffusion (via ColabDesign) to generate 100 backbone scaffolds. Refine sequences with ProteinMPNN.
- Filtering: Filter sequences by:
- pLDDT > 80 (from AlphaFold2 prediction).
- Hydrophobicity < 0.4 (from sequence analysis).
- Unique top 5 sequences for synthesis.
- Synthesis: Order gene fragments, clone into pET-29b(+) vector, transform into BL21(DE3) cells.
- Expression Test: Express in 5 mL cultures, analyze solubility via SDS-PAGE of supernatant vs. pellet.
Protocol 2: High-Diversity epPCR Library Construction
- Reaction Mix:
- 10 ng template DNA
- 1x
Mutazyme IIbuffer - 0.3 mM MnCl2
- 0.2 mM each dNTP
- 0.5 µM each primer
- 1 µL
Mutazyme IIpolymerase - H2O to 50 µL
- Thermocycling: 95°C for 2 min; [95°C for 30s, 55°C for 30s, 72°C for 1 min/kb] x 30 cycles; 72°C for 5 min.
- Purification: Gel-purify the product. Clone into your expression vector using Gibson assembly.
- Quality Control: Sequence 20 random colonies to confirm a target mutation rate of 2-5 mutations/kb.
Visualizations
Title: Three Pathways for Protein Design
Title: Troubleshooting AI-Generated Protein Expression
The Scientist's Toolkit: Key Research Reagent Solutions
| Reagent/Material | Provider/Example | Function in Design Workflow |
|---|---|---|
| Mutazyme II Kit | Agilent Technologies | Provides balanced, high-fidelity random mutagenesis for directed evolution library construction. |
| Yeast Display Vector (pYD1) | Thermo Fisher Scientific | Enables surface display of protein libraries for FACS-based binding selection. |
| Rosetta Software Suite | University of Washington | Industry-standard software for de novo protein design and structural refinement. |
| ProteinMPNN (Colab) | Public Server (GitHub) | Robust neural network for fixed-backbone sequence design, often used to "fix" AI-generated backbones. |
| Crystal Screen HT | Hampton Research | Initial sparse-matrix screen for identifying crystallization conditions of de novo designs. |
| HisTrap HP Column | Cytiva | Standard affinity chromatography for purifying histidine-tagged designed proteins. |
| Biolayer Interferometry (Octet) | Sartorius | Label-free kinetics measurement for rapid characterization of designed binding proteins. |
| Stable CHO Cell Line | ATCC | Host for expressing complex, disulfide-rich designed proteins requiring mammalian post-translational modifications. |
Troubleshooting & FAQs
This technical support center addresses common experimental challenges in protein engineering, framed within the imperative to balance novel design exploration with the reliability required for translation.
Enzyme Engineering Troubleshooting
Q1: My engineered enzyme shows excellent activity in a purified assay but fails in whole-cell or lysate applications. What could be the cause?
A: This is a classic exploration-reliability gap. Exploration focuses on core activity; reliability requires stability in complex environments.
- Cause 1: Proteolytic Degradation. Your novel scaffold may contain cryptic protease cleavage sites.
- Troubleshooting: Run a stability time-course in lysate. Add protease inhibitor cocktails. If degradation occurs, use computational tools (e.g., PROSPER) to identify and mutate susceptible loops.
- Cause 2: Off-target binding or aggregation. Explorative designs may have exposed hydrophobic patches.
- Troubleshooting: Perform size-exclusion chromatography post-lysate incubation. Check for loss of soluble monomer. Use surface entropy reduction or charge engineering to improve solubility.
Q2: How do I improve the thermostability of a novel enzyme variant without sacrificing catalytic efficiency?
A: This requires a balanced iterative design.
- Protocol: Computational Stability Design with Functional Constraints.
- Generate a homology model or use your crystal structure.
- Use a tool like Rosetta ddG_monomer or FoldX to predict stabilizing point mutations (e.g., hydrophobic packing, helix capping, disulfide introduction).
- Filter all predictions through a catalytic site distance filter (e.g., >15 Å from active site residues) to preserve function.
- Create a combinatorial library of the top 5-8 predictions using site-saturation mutagenesis at each position.
- Screen first for stability (thermal shift assay), then assay active clones for function.
Therapeutic Antibody Development
Q3: My humanized antibody shows a severe loss of affinity (>100-fold) compared to the murine parent. What steps should I take?
A: This highlights the risk in explorative humanization frameworks.
- Systematic Troubleshooting Guide:
- Check CDR grafting integrity: Sequence verify. Ensure no framework mutations were introduced into CDRs.
- Analyze Vernier zone residues: Use AbNum/Chothia numbering. Murine framework residues in the "Vernier zone" (underpinning CDRs) may be critical. Revert to murine residues at these key positions (e.g., H71, H73).
- Address immunogenicity risk: If reverting to murine residues, use a database (e.g., T20) to check if the resulting sequence is a known human germline to mitigate immunogenicity.
- Consider SDR grafting: If affinity is not restored, move beyond CDR grafting. Use a structure-guided approach to graft only the Specificity-Determining Regions (SDRs).
Q4: During scale-up, my IgG1 shows increased aggregation. What are the likely culprits?
A: A reliability challenge moving from exploration to production.
- FAQs & Solutions:
- Culprit: Surface instability from a hydrophilic-to-hydrophobic mutation (e.g., introduced for affinity).
- Solution: Perform in silico aggregation propensity analysis (e.g., with CamSol). Revert or compensate with a stabilizing mutation.
- Culprit: Fragmentation due to chemical degradation (e.g., deamidation) in a novel CDR sequence.
- Solution: Use mass spectrometry to identify degradation hotspots. If in a CDR, consider a conservative residue substitution that maintains affinity.
- Culprit: Surface instability from a hydrophilic-to-hydrophobic mutation (e.g., introduced for affinity).
Novel Scaffold Protein Issues
Q5: My designed repeat protein (e.g., DARPIn, TPR) exhibits non-specific binding in flow cytometry, despite high target affinity.
A: This is an exploration liability—novel shapes can have unexpected electrostatic or hydrophobic interactions.
- Diagnostic Protocol: Charge and Hydrophobicity Analysis.
- Calculate the theoretical pI and net charge of your scaffold at pH 7.4. A highly positive charge (>+8) can cause heparin-like sticking to cell surfaces.
- Perform a "blot negativity" control: Test binding to cells known not to express the target. If signal persists, it's non-specific.
- Solution: Iteratively mutate surface-exposed basic residues (K, R) to neutral (Q, N) or acidic (E, D) residues, focusing on regions distal to the target-binding interface. Re-test after each round.
Q6: How can I efficiently map the functional epitope on a novel binding scaffold?
A: Balance high-throughput exploration with reliable identification.
- Protocol: Deep Mutational Scanning (DMS) for Epitope Mapping.
- Create a yeast or phage display library covering all scaffold residues with modest diversity (e.g., NNK at each position).
- Pan/sort the library against both the target protein and an irrelevant protein (for negative selection).
- Use NGS to count variant frequencies pre- and post-selection.
- Calculate enrichment scores. Residues where mutations abolish binding to the target but not to the negative control define the functional epitope.
Table 1: Comparison of Protein Engineering Platforms
| Platform | Typical Library Size | Affinity Achievable (KD) | Development Timeline (Months) | Key Challenge (Exploration vs. Reliability) |
|---|---|---|---|---|
| Murine Hybridoma | ~10⁴ | nM - pM | 6-8 | Immunogenicity (Requires humanization) |
| Phage Display (Human) | 10⁹ - 10¹¹ | nM - pM | 8-12 | Off-target binding of framework |
| Yeast Surface Display | 10⁷ - 10⁹ | nM - fM | 6-10 | Eukaryotic expression bias |
| DARPIn Scaffold | 10¹⁰ - 10¹² | nM - pM | 5-8 | Non-specific binding of novel shape |
| Computational de novo Design | In silico | µM - nM (first pass) | 3-6 (design + test) | In vivo stability & folding |
Table 2: Common Enzyme Engineering Metrics & Outcomes
| Parameter | Typical Goal | Troubleshooting Threshold | Common Assay |
|---|---|---|---|
| Catalytic Efficiency (kcat/Km) | Increase >10-fold | <2-fold improvement not significant | Michaelis-Menten kinetics |
| Thermal Stability (Tm) | Increase >10°C | ΔTm < +3°C may be insufficient | Differential Scanning Fluorimetry |
| Solvent/Co-solvent Tolerance | >20% co-solvent | Activity <50% in <10% co-solvent | Activity assay in buffer/cosolvent mix |
| Expression Yield (E. coli) | >50 mg/L | <10 mg/L scales poorly | Purified protein from 1L culture |
The Scientist's Toolkit: Research Reagent Solutions
| Reagent / Material | Function in Protein Engineering | Example Use-Case |
|---|---|---|
| Site-Directed Mutagenesis Kit (e.g., Q5) | Introduces specific point mutations for validation or stabilization. | Rerouting a hydrophobic patch in a novel scaffold to reduce aggregation. |
| Mammalian Display Library (e.g., Lentiviral) | Presents complex proteins (like antibodies) in their native glycosylated state. | Selecting for antibodies with optimal biophysical properties early in discovery. |
| Protease Inhibitor Cocktail (e.g., cOmplete) | Protects engineered proteins from degradation in complex biological mixtures. | Testing enzyme stability in cell lysate for reliable application data. |
| Anti-Aggregation Surfactants (e.g., Pluronic F-68) | Minimizes non-specific aggregation and surface adsorption. | Improving recovery of a hydrophobic enzyme during purification. |
| Thermal Shift Dye (e.g., SYPRO Orange) | Monitors protein unfolding in real-time to measure stability (Tm). | High-throughput screening of designed enzyme variants for thermostability. |
| Protein A/G/L Beads | Captures antibodies or Fc-fused scaffolds for purification or pull-down. | Rapid validation of antibody expression and specificity from crude supernatant. |
| BLI or SPR Biosensor Chips | Label-free measurement of binding kinetics (ka, kd, KD). | Quantifying the affinity gain of an engineered antibody clone reliably. |
| Size-Exclusion Chromatography Column (e.g., Superdex) | Separates monomers from aggregates and assesses sample homogeneity. | Critical QC step before initiating in vivo studies with any novel protein. |
Experimental Workflow & Pathway Visualizations
Title: Balancing Exploration and Reliability in Enzyme Design
Title: Antibody Humanization Troubleshooting Path
Title: Diagnosing Novel Scaffold Non-Specific Binding
Troubleshooting Guides & FAQs for Protein Design Experiments
Thesis Context: This technical support content is framed within a broader thesis on Balancing exploration and reliability in protein sequence design research. It addresses common computational and experimental pitfalls encountered when mapping trade-offs, such as stability vs. affinity or expressibility vs. novelty.
FAQ 1: Why does my Pareto frontier show a sharp cliff instead of a smooth trade-off curve? Answer: This typically indicates a lack of sufficient sampling in the intermediate design space. Your algorithm (e.g., MOEA/D, NSGA-II) is likely converging too quickly to extreme optima. Increase population size and generations, and consider incorporating diversity-preservation mechanisms. Check your objective function landscapes for discontinuities.
FAQ 2: How do I handle conflicting quantitative metrics with different units or scales? Answer: Normalization is critical before multi-objective optimization. Use a scaling method (e.g., Min-Max, Z-score) to prevent one objective from dominating purely due to its numerical magnitude. Validate that the scaled ranges meaningfully reflect biological priorities.
FAQ 3: My predicted Pareto-optimal sequences perform poorly in experimental validation. What went wrong? Answer: This is a core reliability challenge. The discrepancy often stems from inaccuracies in the in silico proxy objectives (e.g., ∆∆G predictors) not capturing the full complexity of the experimental readout. Implement a robustness check by including a "prediction uncertainty" metric as a third objective or filtering designs based on ensemble predictor variance.
FAQ 4: How can I efficiently explore the sequence space without exponential computational cost? Answer: Employ adaptive sampling strategies. Start with a broad, low-resolution exploration (e.g., using a generative model or directed evolution library data) to identify promising regions. Then, iteratively focus computational resources on refining the Pareto front in those regions using higher-fidelity but more expensive simulations or predictors.
Experimental Protocol: Generating a Pareto Frontier for Stability-Activity Trade-Off
Objective: To experimentally characterize the trade-off between protein thermostability (ΔTm) and catalytic activity (kcat/Km) for a set of designed enzyme variants.
Methodology:
- In Silico Design & Pareto Sampling: Using a sequence design tool (e.g., Rosetta, ProteinMPNN), generate a diverse library targeting a scaffold. Score each design with two predictors: a folding stability score (e.g., ∆∆G Fold) and a functional motif conservation score.
- Multi-Objective Optimization: Input the scored library into an algorithm like NSGA-II to identify the non-dominated set, creating a predicted Pareto frontier.
- Strategic Selection: Select 15-20 variants for experimental testing: 5-6 from the predicted Pareto front, and the rest as off-frontier controls (clearly stable-but-inactive and active-but-unstable).
- Cloning & Expression: Clone genes into an appropriate expression vector (e.g., pET series). Express in E. coli BL21(DE3) cells, induce with IPTG, and purify via His-tag affinity chromatography.
- Experimental Assays:
- Stability (ΔTm): Measure using a differential scanning fluorimetry (DSF) assay. Report the shift in melting temperature relative to wild-type.
- Activity (kcat/Km): Perform enzyme kinetics assays under standardized conditions using a spectrophotometric or fluorometric substrate assay.
- Data Integration: Plot experimental ΔTm vs. kcat/Km. Compare the experimentally determined Pareto frontier to the computationally predicted one to validate the proxies.
Data Presentation: Comparative Analysis of Pareto Frontier Generation Algorithms
Table 1: Performance of Multi-Objective Algorithms for Protein Design
| Algorithm | Key Principle | Pros for Protein Design | Cons for Protein Design | Recommended Use Case |
|---|---|---|---|---|
| NSGA-II | Non-dominated sorting & crowding distance | Excellent spread of solutions; handles 2-3 objectives well. | Performance degrades with >3 objectives; computationally heavy. | Standard benchmark for 2-3 objective problems (e.g., Stability, Activity, Expressibility). |
| MOEA/D | Decomposes problem into scalar subproblems | Efficient for many objectives; good convergence. | Solution diversity can be low; sensitive to weight vectors. | High-dimensional objective spaces (≥4 objectives). |
| Random ForestSurrogate | Uses machine learning model as fast proxy | Dramatically reduces calls to slow biophysics models. | Requires initial training data; model error can mislead search. | When objectives involve slow molecular dynamics or FEP calculations. |
| ϵ-DominanceArchiving | Maintains an archive of solutions within ϵ-grid | Provides guaranteed coverage and progress. | Tuning of ϵ parameter is non-trivial. | Ensuring uniform exploration and reliable coverage of the trade-off space. |
Table 2: Common Objective Function Pairs & Validation Methods
| Design Goal | Objective 1 (Proxy) | Objective 2 (Proxy) | Experimental Validation |
|---|---|---|---|
| Therapeutic Antibody | Stability (∆∆G Pred.) | Target Affinity (MM/GBSA) | SPR (Affinity), DSF/CE-SDS (Stability) |
| Enzyme Engineering | Folding Probability (pLDDT) | Catalytic Site Geometry (RMSD) | Kinetic Assay (kcat/Km), Thermal Shift (Tm) |
| De Novo Protein | Hydrophobic Packing (Rosetta score) | Shape Complementarity (SC) | SEC-MALS (Monodispersity), CD (Folding) |
The Scientist's Toolkit: Research Reagent Solutions
| Item | Function in Pareto Frontier Experiments |
|---|---|
| Rosetta Suite | Provides a suite of energy functions for in silico scoring of stability, binding, and other biophysical objectives. |
| ProteinMPNN | A deep learning-based protein sequence design tool for generating diverse, stable backbone-conditioned sequences. |
| PyMOL | Visualization software for analyzing and comparing 3D structures of Pareto-optimal variants. |
| pET Vector System | High-expression E. coli system for reliable production of protein variants for experimental validation. |
| Differential Scanning Fluorimetry (DSF) Kit | Enables high-throughput measurement of protein thermal stability (Tm) for dozens of variants. |
| Surface Plasmon Resonance (SPR) Chip | For precise, quantitative measurement of binding kinetics (ka, kd, KD) of designed binders. |
| Size Exclusion Chromatography with MALS (SEC-MALS) | Determines absolute molecular weight and aggregation state, critical for assessing solution behavior. |
| Plackett-Burman Design Software | Statistical tool for designing efficient screening experiments when validating a subset of Pareto-optimal points. |
Visualizations
Title: Pareto Frontier Generation Workflow for Protein Design
Title: Conceptual Pareto Frontier for Stability vs. Activity
Conclusion
Balancing exploration and reliability is not a fixed target but a dynamic, context-dependent optimization crucial for advancing protein design. Successful strategies integrate generative AI's exploratory power with the grounding constraints of evolutionary data and physics-based models, all within iterative experimental cycles. The future lies in adaptive, closed-loop systems where computational design and ultra-high-throughput characterization (e.g., via deep mutational scanning or cell-free synthesis) are seamlessly integrated. Mastering this balance will accelerate the development of previously unimaginable proteins, pushing the boundaries of drug discovery, synthetic biology, and molecular medicine. The next frontier is moving beyond single-property optimization to multi-objective design of proteins that are novel, stable, specific, and expressible—all at once.