Engineering Protein-Based Therapeutics: Design Strategies, Stability Solutions, and Clinical Applications
This article provides a comprehensive overview of the engineering strategies revolutionizing protein-based therapeutics.
Engineering Protein-Based Therapeutics: Design Strategies, Stability Solutions, and Clinical Applications
Abstract
This article provides a comprehensive overview of the engineering strategies revolutionizing protein-based therapeutics. It explores the foundational advantages of biologics over small molecules, details established and emerging protein engineering methodologies, and addresses critical challenges in stability, immunogenicity, and delivery. Aimed at researchers, scientists, and drug development professionals, the content synthesizes current literature to offer insights into optimizing pharmacokinetics, overcoming aggregation, and validating therapeutic efficacy through computational and experimental approaches, ultimately framing the future trajectory of this rapidly advancing field.
The Rise of Protein Therapeutics: From Recombinant Technology to a $400 Billion Market
Protein-based therapeutics have revolutionized modern medicine, emerging as rivaling or superior alternatives to traditional small-molecule drugs [1]. Projected to constitute half of the top ten selling drugs, proteins offer unique advantages rooted in their complex biological origins and versatile functionalities [1]. This document outlines the inherent advantages of protein-based therapeutics through the lenses of specificity, potency, and complex functionality, providing application notes and detailed protocols to facilitate research and development in this rapidly advancing field. The global market for protein-engineered products exceeds $300 billion annually, with projections suggesting a compound annual growth rate of nearly 10% over the next decade, underscoring the significant impact and future potential of these biologics [2].
Quantitative Advantages of Protein Therapeutics
Table 1: Key Advantages of Protein-Based Therapeutics vs. Small Molecule Drugs
| Characteristic | Protein-Based Therapeutics | Small Molecule Drugs |
|---|---|---|
| Specificity | High target specificity through precise molecular recognition (e.g., antibody-antigen interactions) | Moderate to low specificity; higher potential for off-target effects |
| Potency | High potency at low concentrations (nanomolar to picomolar range) | Typically micromolar potency required |
| Functionality | Capable of executing complex functions (enzyme catalysis, receptor activation, immune recruitment) | Generally limited to inhibition or activation of target |
| Development Timeline | Longer (3-7 years for discovery and optimization) | Shorter (1-3 years for discovery and optimization) |
| Production Complexity | High (requires biological systems, complex purification) | Low to moderate (chemical synthesis) |
| Thermodynamic Stability | Variable (often requires cold chain storage) | Generally high stability at room temperature |
Table 2: Market Impact of Major Protein Therapeutic Classes
| Therapeutic Class | Estimated Market Value (USD) | Key Indications | Representative Examples |
|---|---|---|---|
| Monoclonal Antibodies | $115.85 billion [3] | Cancer, autoimmune diseases | Adalimumab, Pembrolizumab [2] |
| Fc Fusion Proteins | $20.69 billion [3] | Inflammatory diseases, rare disorders | Abatacept [1] |
| Blood Factors | $4.76 billion [3] | Hemophilia | Factor VIII, Factor IX |
| Therapeutic Enzymes | Part of $15.1 billion "Other" segment [3] | Metabolic disorders, enzyme deficiencies | Imiglucerase, Agalsidase beta |
| Insulin and Analogs | Significant segment of protein therapeutics market [4] | Diabetes | Insulin glargine, Insulin glulisine [1] |
Application Note: Leveraging Specificity in Therapeutic Antibodies
Theoretical Framework
Monoclonal antibodies (mAbs) exemplify the superior specificity of protein therapeutics through their fundamental structure-function relationship. The Y-shaped immunoglobulin structure contains variable regions that form precise antigen-binding sites through complementarity-determining regions (CDRs) [5]. These CDRs create extensive surface contact areas with targets through diverse non-covalent interactions, including hydrogen bonding, van der Waals forces, and electrostatic interactions, enabling discrimination between structurally similar epitopes that small molecules cannot achieve [1] [5].
The specificity advantage translates directly to clinical benefits: reduced off-target effects, minimized adverse reactions, and enhanced therapeutic efficacy at lower doses. Engineering approaches further enhance this natural specificity through affinity maturation, humanization to reduce immunogenicity, and creation of bispecific formats that simultaneously engage multiple targets [1] [3].
Experimental Protocol: Surface Plasmon Resonance (SPR) for Binding Affinity Measurement
Purpose: Quantify binding affinity and kinetics between therapeutic proteins and targets.
Materials:
- Biacore or equivalent SPR instrument
- CM5 sensor chip
- Running buffer: HBS-EP (10 mM HEPES, 150 mM NaCl, 3 mM EDTA, 0.05% v/v Surfactant P20, pH 7.4)
- Amine coupling kit: 1-ethyl-3-(3-dimethylaminopropyl)carbodiimide (EDC), N-hydroxysuccinimide (NHS)
- Ethanolamine hydrochloride
- Purified target antigen (10-50 µg)
- Therapeutic antibody/protein samples (serial dilutions)
Procedure:
Sensor Chip Preparation:
- Dock CM5 sensor chip and prime system with running buffer
- Mix equal volumes of NHS and EDC from amine coupling kit
- Inject NHS/EDC mixture for 7 minutes to activate dextran surface
Ligand Immobilization:
- Dilute target antigen to 5-50 µg/mL in 10 mM sodium acetate buffer (pH 4.0-5.0)
- Inject antigen solution for 7-15 minutes to achieve desired immobilization level (typically 5-100 response units)
- Inject ethanolamine hydrochloride for 7 minutes to block remaining activated groups
Binding Kinetics Analysis:
- Prepare 2-fold serial dilutions of therapeutic protein in running buffer (typically 0.78-100 nM)
- Inject samples over ligand and reference surfaces for 2-5 minutes association phase
- Monitor dissociation for 10-30 minutes with running buffer flow
- Regenerate surface with 10 mM glycine-HCl (pH 1.5-2.5) for 30-60 seconds between cycles
Data Analysis:
- Subtract reference cell and buffer blank responses
- Fit sensograms to 1:1 Langmuir binding model or more complex models as needed
- Report association rate (kₐ), dissociation rate (kḍ), equilibrium dissociation constant (K_D = kḍ/kₐ), and binding response at equilibrium
Troubleshooting Notes:
- If binding responses are too weak, increase ligand immobilization level or sample concentration
- If regeneration is incomplete, test alternative regeneration solutions (higher/lower pH, chaotropic agents)
- If nonspecific binding is observed, increase salt concentration or add surfactant to running buffer
Application Note: Enhancing Potency Through Engineering
Theoretical Framework
Protein therapeutics achieve exceptional potency through high-affinity interactions and efficient engagement of biological systems. While small molecules typically exhibit micromolar affinity, engineered proteins routinely achieve nanomolar to picomolar binding constants, enabling effective dosing at dramatically lower molar concentrations [1].
Several engineering strategies enhance potency:
- Affinity Maturation: Introducing targeted mutations in binding interfaces to improve complementary shape and chemical interactions
- Avidity Effects: Multivalent binding through Fc regions or multimeric formats increases functional affinity
- Structure-Guided Design: Using computational and structural data to optimize key interacting residues while maintaining favorable developability properties [1] [5]
A notable example includes insulin analogs engineered for tailored pharmacokinetics, such as insulin glargine, which forms subcutaneous precipitates for extended action, and insulin glulisine, with reduced self-association for rapid effect [1].
Experimental Protocol: Site-Saturation Mutagenesis for Affinity Enhancement
Purpose: Systematically improve binding affinity through comprehensive residue scanning.
Materials:
- Template DNA encoding protein of interest
- NNK codon primers (N = A/T/G/C, K = G/T)
- High-fidelity DNA polymerase
- DpnI restriction enzyme
- Competent E. coli cells
- Expression vector and host system
- Screening platform (ELISA, FACS, or phage display)
Procedure:
Library Design:
- Identify target residues for mutagenesis (typically CDRs or binding interface residues)
- Design forward and reverse primers containing NNK codons flanked by 15-20 bp homologous sequences
- NNK codons encode all 20 amino acids while reducing stop codons
Library Construction:
- Set up PCR reaction with template DNA and mutagenic primers
- Parameters: 98°C for 30 sec; 18 cycles of 98°C for 10 sec, 55-60°C for 30 sec, 72°C for 2-4 min/kb; 72°C for 5 min
- Digest parental template with DpnI (37°C for 1-2 hours)
- Purify PCR product and transform into competent E. coli cells
- Plate transformed cells to determine library diversity (>10⁴ clones recommended)
Library Screening:
- Express mutant library in appropriate system (phage, yeast, or bacterial display)
- Perform 2-3 rounds of selection with decreasing target antigen concentration
- Isolate individual clones and characterize binding affinity via SPR or ELISA
Hit Characterization:
- Sequence confirmed hits to identify beneficial mutations
- Combine beneficial mutations through site-directed mutagenesis
- Characterize final variants for affinity, expression, and stability
Advanced Applications:
- For multi-parameter optimization, combine with computational design using spatial aggregation propensity (SAP) calculations to mitigate aggregation risk while enhancing affinity [1]
- Implement deep sequencing to quantify enrichment ratios across selection rounds
Research Reagent Solutions
Table 3: Essential Research Reagents for Protein Therapeutic Development
| Reagent/Category | Specific Examples | Function/Application |
|---|---|---|
| Expression Systems | CHO cells, HEK293 cells, E. coli, P. pastoris | Recombinant protein production with appropriate post-translational modifications |
| Purification Resins | Protein A/G/L, Ni-NTA, ion-exchange, size-exclusion | Isolation and purification of target proteins from complex mixtures |
| Analytical Instruments | Biacore/SPR, HPLC-SEC, mass spectrometers, spectroscopy systems [4] | Characterization of binding, purity, and structural integrity |
| Stabilization Reagents | Trehalose, sucrose, polysorbates, amino acid excipients | Enhanced shelf-life and in vivo stability through aggregation inhibition |
| Display Technologies | Phage display, yeast display, ribosome display | High-throughput screening of protein libraries for affinity and stability |
| Cell-Based Assays | ADCC reporter assays, complement activation, cell proliferation | Functional assessment of therapeutic mechanisms and potency |
| Computational Tools | Molecular dynamics software, AlphaFold, docking programs [5] | In silico prediction and optimization of protein structure and function |
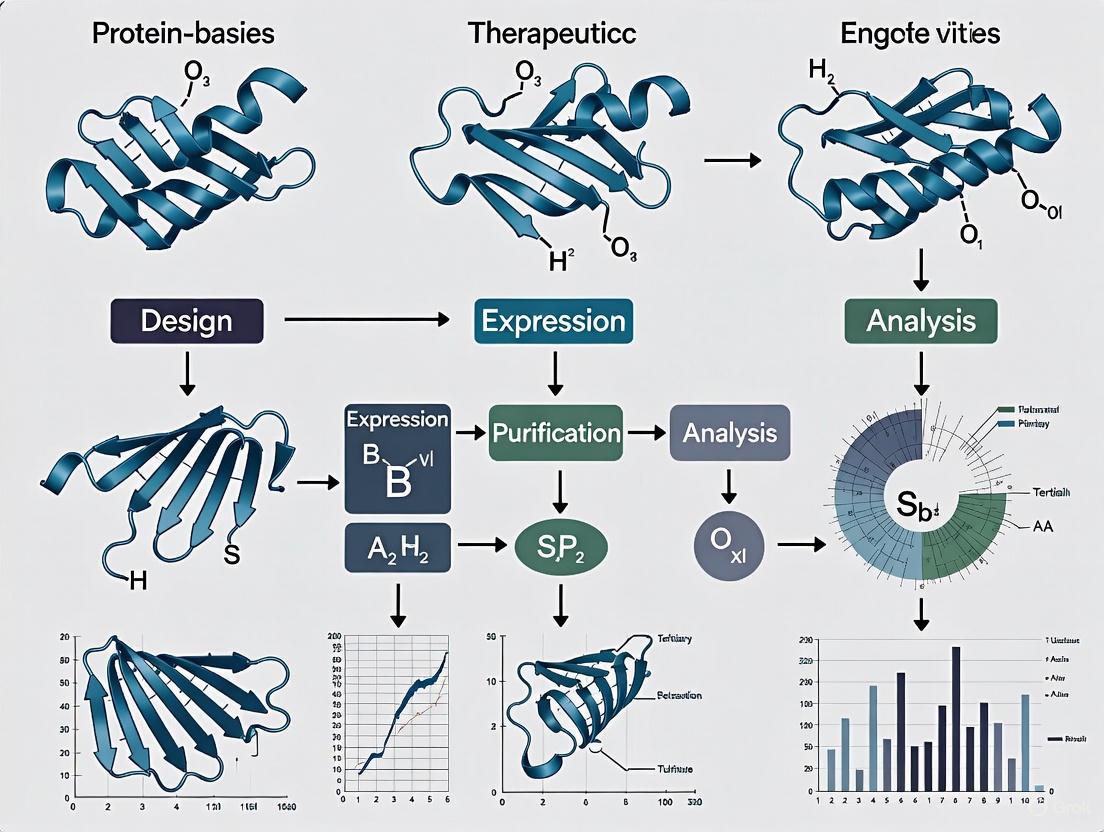
Visualization: Experimental Workflow for Developing Optimized Protein Therapeutics
Diagram 1: Protein Therapeutic Development Workflow
Diagram 2: Engineering Strategies for Enhanced Properties
Application Note: Achieving Complex Functionality
Theoretical Framework
Protein therapeutics execute sophisticated biological functions that small molecules cannot replicate, including:
- Enzymatic Activity: Catalyzing specific biochemical reactions (e.g., enzyme replacement therapies)
- Signal Transduction: Activating or inhibiting complex cellular signaling pathways through receptor engagement
- Immune Recruitment: Directing immune effector functions against target cells (e.g., ADCC, CDC)
- Multi-target Engagement: Simultaneously modulating multiple biological targets (e.g., bispecific antibodies) [1] [5]
This functional complexity enables therapeutic approaches for conditions previously considered "undruggable" with small molecules. For example, antibody-drug conjugates (ADCs) combine the targeting specificity of antibodies with the potent cytotoxicity of small molecules, creating precisely targeted delivery systems that minimize systemic toxicity [3].
Experimental Protocol: Fc Engineering for Enhanced Effector Function
Purpose: Modulate antibody Fc region to optimize therapeutic effector functions.
Materials:
- Expression vector encoding antibody with Fc region
- Site-directed mutagenesis kit
- Mammalian expression system (e.g., Expi293F cells)
- Protein A purification resin
- ADCC reporter bioassay kit
- Complement activation assay components
- Fcγ receptor binding assay materials
Procedure:
Fc Modification Design:
- Identify target residues in CH2 domain affecting FcγR binding (e.g., S298, E333, K334)
- For enhanced effector function: introduce S298A/E333A/K334A mutations
- For reduced effector function: introduce L234A/L235A (LALA) mutations
- Design mutagenic primers with 15-20 bp flanking sequences
Construct Generation:
- Perform site-directed mutagenesis as described in Section 4.2
- Sequence confirm mutated constructs
- Transiently transfect Expi293F cells according to manufacturer protocol
- Harvest culture supernatant after 5-7 days
Antibody Purification:
- Clarify culture supernatant by centrifugation and filtration
- Load onto Protein A column equilibrated with binding buffer
- Wash with 10 column volumes of binding buffer
- Elute with low pH elution buffer (100 mM glycine, pH 2.5-3.0)
- Immediately neutralize eluate with Tris buffer, pH 8.0
- Dialyze into PBS or formulation buffer
Effector Function Assessment:
- ADCC Reporter Assay:
- Seed effector cells expressing FcγRIIIa and NFAT-responsive luciferase
- Add target cells expressing target antigen
- Titrate purified antibodies and incubate 6-24 hours
- Add luciferase substrate and measure luminescence
- Complement Activation:
- Immobilize target antigen on ELISA plate
- Add antibody samples followed by human complement source
- Detect complement deposition with specific antibodies
- FcγR Binding:
- Perform SPR with immobilized Fcγ receptors
- Compare binding kinetics of engineered vs. wild-type Fc
- ADCC Reporter Assay:
Data Interpretation:
- Enhanced ADCC typically shows 2-10 fold increased potency in reporter assays
- Reduced effector function should show minimal activation above background
- Correlate binding affinity changes with functional outcomes
Protein therapeutics represent a paradigm shift in pharmaceutical development, offering distinct advantages in specificity, potency, and functional complexity compared to traditional small molecules. The experimental protocols and application notes provided herein offer researchers comprehensive methodologies to characterize and enhance these inherent advantages through state-of-the-art techniques. As protein engineering continues to evolve through advances in computational design, AI-driven optimization, and novel delivery strategies [2] [5], the therapeutic potential of biologics will further expand, enabling treatment of increasingly complex diseases with unprecedented precision and efficacy.
Protein Engineering Toolbox: Rational Design, Directed Evolution, and De Novo Synthesis
Rational protein design represents a structured methodology for engineering proteins with enhanced therapeutic properties by leveraging detailed knowledge of protein structure-function relationships. This approach stands in contrast to directed evolution, relying instead on computational predictions and precise, targeted mutations to achieve desired outcomes such as improved stability, reduced immunogenicity, and enhanced efficacy. For researchers and drug development professionals working on protein-based therapeutics, rational design offers a strategic pathway to optimize biologics including monoclonal antibodies, therapeutic enzymes, and novel protein scaffolds [1] [5]. The fundamental premise of rational design is that a comprehensive understanding of a protein's three-dimensional architecture—encompassing its primary amino acid sequence, secondary structural elements (alpha helices and beta sheets), tertiary fold, and quaternary assemblies—enables informed manipulation of its biophysical and functional characteristics [5]. This methodology has become increasingly powerful with advances in computational structural biology, allowing researchers to move beyond natural protein templates and create de novo designs with atomic-level precision [6].
The strategic importance of rational design in biopharmaceutical development cannot be overstated. Engineered protein therapeutics now constitute nearly half of the top-selling drugs, demonstrating their significant impact on modern medicine [1]. This success stems from key advantages over traditional small-molecule drugs, including higher specificity for their molecular targets, reduced off-target effects, and the capacity to perform complex biological functions [1] [5]. However, the development process faces considerable challenges related to protein folding, stability, aggregation propensity, and potential immunogenicity—hurdles that rational design approaches are specifically equipped to address [5] [7]. By systematically applying structure-guided engineering, researchers can transform inherently unstable or poorly functioning proteins into robust therapeutic agents, thereby accelerating the transition from laboratory discovery to clinical application.
Core Principles: Integrating Structural Knowledge with Functional Outcomes
Structural Determinants of Protein Function
The foundation of rational protein design rests upon a thorough understanding of protein structural hierarchy and its relationship to biological function. Proteins exhibit four distinct levels of structural organization: primary (linear amino acid sequence), secondary (local folding patterns including alpha-helices and beta-sheets), tertiary (overall three-dimensional conformation), and quaternary (assembly of multiple polypeptide chains) [5]. Each level contributes critically to protein function. The primary structure dictates folding pathways and determines key physicochemical properties; secondary structures provide structural framework and mediate molecular recognition; tertiary structure creates specific binding pockets and catalytic sites; and quaternary structure enables complex allosteric regulation and multi-subunit functionality [5]. Rational design interventions must account for this structural complexity, as modifications at one level can profoundly influence properties at other levels.
Protein function emerges directly from structural features. Enzymatic activity depends on precise geometric arrangement of catalytic residues; antibody-antigen recognition derives from complementary surface topography; and allosteric regulation arises from specific conformational transitions [5]. Understanding these structure-function relationships enables targeted interventions. For instance, strategic mutations in kinase domains can modulate enzymatic activity by altering the equilibrium between active and inactive conformations [8]. Similarly, modifications to antibody Fc regions can fine-tune effector functions or serum half-life by changing binding interactions with Fc receptors [1]. The structural basis for these functional outcomes provides the conceptual framework for rational design strategies aimed at optimizing therapeutic proteins for specific clinical applications.
Computational Framework for Structure-Guided Design
Modern rational protein design employs sophisticated computational tools that leverage structural information to predict the effects of mutations. Molecular dynamics (MD) simulations model atomic-level movements over time, revealing conformational flexibility, folding pathways, and structural stability under varying physiological conditions [5]. Docking studies predict binding orientations and affinities between proteins and their interaction partners, enabling virtual screening of potential therapeutic candidates [5]. Artificial intelligence (AI) and machine learning approaches have revolutionized the field by extracting patterns from vast structural datasets to predict folding, stability, and function directly from sequence information [6] [5].
Table 1: Key Computational Tools for Rational Protein Design
| Tool Category | Representative Examples | Primary Applications | Therapeutic Relevance |
|---|---|---|---|
| Structure Prediction | AlphaFold, ESM-2 | Predicting 3D structures from amino acid sequences | Identifying functional domains and potential mutation sites [8] [5] |
| Molecular Dynamics | GROMACS, AMBER | Simulating protein dynamics, folding, and stability | Evaluating mutation effects on structural integrity [5] |
| Aggregation Prediction | Aggrescan3D (A3D) | Identifying aggregation-prone regions on protein surfaces | Engineering stable, soluble therapeutics [7] |
| Domain Insertion | ProDomino | Predicting permissive sites for domain insertion | Creating allosteric protein switches [9] |
| Variant Interpretation | Kinase Mutation Atlas | Annotating functional significance of mutations | Personalizing cancer therapies based on structural clusters [8] |
These computational tools enable in silico prototyping of protein variants, significantly reducing the experimental burden by prioritizing designs most likely to succeed. For example, AI-driven de novo protein design now enables first-principle engineering of protein-based functional modules unbound by evolutionary constraints, opening possibilities for creating entirely novel therapeutic proteins [6]. Similarly, tools like Aggrescan3D allow researchers to predict and mitigate aggregation propensity—a common challenge in therapeutic protein development—by identifying surface-exposed aggregation-prone regions and suggesting mutations to enhance solubility [7]. The integration of these computational approaches creates a powerful framework for systematic protein optimization before experimental validation.
Methodologies: Computational and Experimental Approaches
Protocol: Structure-Based Solubility Engineering Using Aggrescan3D
Protein aggregation presents a major obstacle in developing biologics, potentially reducing efficacy and increasing immunogenicity risk. The Aggrescan3D (A3D) standalone package provides a method for rationally designing protein solubility based on three-dimensional structures [7]. This protocol outlines the systematic process for using A3D to identify aggregation-prone regions and design stabilizing mutations.
Step 1: Input Structure Preparation and Analysis Begin by obtaining a high-quality three-dimensional structure of your target protein. Sources may include experimental determinations (X-ray crystallography, cryo-EM) or computational predictions (AlphaFold, ESM-2). Load the structure into A3D and run the initial aggregation propensity analysis. The algorithm will calculate intrinsic aggregation tendencies for each residue, mapping "hot spots" on the protein surface that contribute most to aggregation propensity.
Step 2: Mutation Planning and In Silico Evaluation Identify surface-exposed residues within aggregation-prone regions that are not critical for structural integrity or function. Prioritize positions where mutations can reduce hydrophobicity or introduce charged residues without disrupting conserved functional domains. Systematically evaluate potential substitutions using A3D's mutation scanning feature, which predicts changes to overall aggregation propensity. Select mutations that significantly reduce aggregation score while maintaining structural stability.
Step 3: Experimental Validation of Designed Variants Express and purify the engineered protein variants using standard systems (e.g., E. coli for non-glycosylated proteins, mammalian cells for complex biologics). Assess aggregation resistance using accelerated stability studies, monitoring for visible precipitates or turbidity. Quantify soluble fraction yields and compare to wild-type protein. For lead candidates, perform detailed biophysical characterization including thermal shift assays, circular dichroism, and size-exclusion chromatography to confirm structural integrity is maintained.
This methodology has been successfully applied to therapeutic antibodies and other biologics, demonstrating that protein solubility can be substantially improved through structure-guided mutations at surface positions [7]. The A3D approach is particularly valuable for addressing aggregation issues without compromising the therapeutic activity of protein drugs.
Protocol: Engineering Allosteric Protein Switches with ProDomino
Allosteric protein switches represent a powerful class of engineered biologics whose activity can be controlled by external stimuli such as light or small molecules. These switches are created by inserting a sensor domain (e.g., photoreceptor or ligand-binding domain) into an effector protein at positions that enable functional coupling. The ProDomino machine learning pipeline rationalizes this process by predicting permissive insertion sites that maintain structural integrity while enabling allosteric control [9].
Step 1: Target Protein Selection and Insertion Site Prediction Select your effector protein of interest (e.g., CRISPR-Cas9, therapeutic enzyme) and identify potential insertion sites using ProDomino. The algorithm employs ESM-2-derived protein sequence representations trained on natural intradomain insertion events to identify positions that tolerate domain insertion without disrupting protein fold. ProDomino analyzes the entire protein sequence, generating an insertion tolerance score for each position.
Step 2: Sensor Domain Integration and Construct Design Choose an appropriate sensor domain based on desired regulation (light-sensitive domains like LOV or ligand-binding domains). Design insertion constructs by flanking the sensor domain with flexible linkers and inserting it at high-scoring ProDomino positions. The structural context is critical—successful switches often place the sensor domain in locations where conformational changes can propagate to the effector's active site. Generate multiple constructs targeting different high-scoring positions to increase success probability.
Step 3: Functional Characterization of Switches Express designed switch variants in appropriate cellular systems (E. coli for initial testing, human cells for therapeutic proteins). Quantify effector activity in the presence and absence of the regulatory stimulus (light or ligand). Effective switches should show significant difference between "on" and "off" states while maintaining high dynamic range. For CRISPR-Cas applications, measure genome editing efficiency under induced versus basal conditions [9]. Optimize linkers and insertion boundaries through iterative design-test cycles to enhance switching performance.
This methodology has enabled creation of novel opto- and chemogenetic protein switches, including light-regulated CRISPR-Cas9 and Cas12a variants for inducible genome engineering in human cells [9]. The ProDomino approach substantially accelerates the design of customized allosteric proteins by replacing extensive experimental screening with computational prediction.
Applications in Therapeutic Protein Engineering
Enhancing Pharmacokinetic Properties
Rational design strategies have proven particularly valuable for optimizing the pharmacokinetic profiles of therapeutic proteins, especially their circulation half-life. A prominent example involves engineering the Fc region of monoclonal antibodies to modulate binding to the neonatal Fc receptor (FcRn), which plays a critical role in antibody recycling and prolonged serum persistence [1]. Specific point mutations (e.g., M428L/N434S "LS" variant or M252Y/S254T/T256E "YTE" variant) enhance pH-dependent binding to FcRn, promoting antibody rescue from lysosomal degradation and resulting in extended half-life [1]. This approach has been successfully translated clinically, with the LS variant utilized in ravulizumab to achieve longer dosing intervals compared to its predecessor eculizumab [1].
Table 2: Rational Design Applications in Protein Therapeutics
| Therapeutic Class | Engineering Strategy | Structural Basis | Clinical Outcome |
|---|---|---|---|
| Monoclonal Antibodies | Fc mutations (LS, YTE) | Enhanced FcRn binding at acidic pH | Extended serum half-life [1] |
| Insulin Analogues | Site-specific mutagenesis (B21-Asn→Gly, B29-Lys→Glu) | Altered isoelectric point or reduced self-association | Rapid-acting (glulisine) or long-acting (glargine) profiles [1] |
| CRISPR-Cas Systems | Domain insertion for allosteric control | Sensor integration at permissive sites identified by ProDomino | Inducible genome editing [9] |
| Kinase Inhibitors | Structural interpretation of VUS | 3D clustering of mutations in kinase domains | Personalized cancer therapy [8] |
| Therapeutic Enzymes | Cysteine to serine substitutions | Prevention of non-native disulfide bonds | Improved stability (aldesleukin, interferon β1b) [1] |
Beyond antibodies, rational design has enabled fine-tuning of insulin pharmacokinetics through strategic mutations that alter self-association properties. Insulin glargine incorporates substitutions that shift the isoelectric point toward physiological pH, causing precipitation upon injection and slow dissolution for prolonged action [1]. Conversely, insulin glulisine features mutations that reduce self-association and lower the isoelectric point, resulting in faster absorption and rapid onset of action [1]. These examples demonstrate how targeted modifications informed by structural knowledge can produce tailored therapeutic profiles to meet specific clinical needs.
Engineering Novel Modalities: CRISPR-Cas Systems and Beyond
Rational design enables creation of entirely new therapeutic modalities through strategic protein engineering. The development of regulated CRISPR-Cas systems exemplifies this potential. By inserting light-sensitive domains into Cas9 and Cas12a at positions predicted by ProDomino, researchers have created optogenetic genome editors whose activity can be precisely controlled with temporal and spatial precision [9]. These engineered systems maintain editing efficiency in the "on" state while showing minimal background activity in the "off" state, representing a significant advance in precision genome engineering for research and therapeutic applications.
Another emerging application involves engineering CRISPR-associated transposases (CASTs) for targeted DNA integration without double-strand breaks. Structure-guided engineering of type I-F CAST systems, including cryo-EM analysis of DNA recognition complexes, has enabled optimization of these systems for human cell genome editing [10]. Rational modifications to the PseCAST QCascade complex based on structural insights have yielded variants with increased integration efficiencies and modified PAM specificities, expanding their utility for therapeutic gene insertion [10]. These advances highlight how rational engineering, informed by detailed structural knowledge, can transform natural bacterial systems into powerful therapeutic tools.
Research Reagent Solutions
The successful implementation of rational protein design requires specialized reagents and tools. The following table outlines essential resources for structure-guided engineering projects.
Table 3: Essential Research Reagents for Rational Protein Design
| Reagent/Tool Category | Specific Examples | Function in Rational Design | Key Features |
|---|---|---|---|
| Structure Prediction | AlphaFold, ESM-2, RosettaFold | Generating 3D models from sequence data | High-accuracy prediction of protein structures [8] [5] |
| Molecular Dynamics | GROMACS, AMBER, NAMD | Simulating protein dynamics and mutation effects | Atomic-level simulation of conformational changes [5] |
| Aggregation Prediction | Aggrescan3D (A3D) Standalone | Identifying and mitigating aggregation-prone regions | Structure-based design of soluble variants [7] |
| Domain Insertion Design | ProDomino Pipeline | Predicting permissive sites for domain fusion | Machine learning-guided creation of protein switches [9] |
| Variant Interpretation | Kinase Mutation Atlas | Annotating functional significance of mutations | Structural clustering of oncogenic mutations [8] |
| Structural Biology | Cryo-EM, X-ray Crystallography | Experimental structure determination | High-resolution structural insights [10] [5] |
| Site-Directed Mutagenesis | Kits (commercial) | Introducing targeted mutations | Precise genetic modifications for validation |
Rational protein design represents a powerful paradigm for advancing protein-based therapeutics through strategic application of structure-function knowledge. By leveraging computational tools like Aggrescan3D for solubility engineering and ProDomino for creating allosteric switches, researchers can systematically optimize therapeutic proteins for enhanced stability, controlled activity, and improved pharmacokinetics. The integration of structural insights with targeted mutagenesis enables precise engineering of biologics that meet increasingly sophisticated therapeutic needs. As computational methods continue to advance, particularly in AI-driven protein design, the scope and impact of rational design approaches will expand further, accelerating the development of next-generation protein therapeutics for diverse clinical applications. For drug development professionals, mastering these rational design methodologies is becoming increasingly essential for success in the competitive landscape of biopharmaceutical innovation.
Directed evolution stands as a cornerstone technique in protein engineering, mimicking the principles of natural selection in a laboratory setting to steer proteins toward user-defined goals. [11] This powerful methodology has transitioned from a novel academic concept to a transformative biotechnology, enabling the development of proteins with enhanced stability, novel catalytic activities, and altered substrate specificity for therapeutic applications. [12] The strategic advantage of directed evolution lies in its capacity to deliver robust solutions without requiring detailed a priori knowledge of a protein's three-dimensional structure or catalytic mechanism, thereby bypassing the limitations of rational design. [12] Since its conceptual origins in Spiegelman's early in vitro evolution experiments with RNA in the 1960s, the field has expanded dramatically, now encompassing a diverse toolkit of methods for genetic diversification and functional screening. [13] [11] The profound impact of this approach was formally recognized with the 2018 Nobel Prize in Chemistry, awarded to Frances Arnold for her pioneering work in directed evolution of enzymes, alongside George Smith and Gregory Winter for phage display. [11]
Core Principles of Directed Evolution
The directed evolution workflow functions as an iterative engine that drives a protein population toward a desired functional goal through repeated cycles of diversification and selection. [12] This process compresses geological timescales of natural evolution into weeks or months by intentionally accelerating mutation rates and applying unambiguous, user-defined selection pressures. [12]
The Directed Evolution Cycle
A typical directed evolution experiment consists of three fundamental steps performed iteratively:
- Diversification: Creating a library of gene variants through mutagenesis.
- Selection/Screening: Identifying variants with improved properties.
- Amplification: Isolating and replicating the genes of superior variants to serve as templates for the next cycle. [11] [12]
This cyclical process allows beneficial mutations to accumulate over successive generations, progressively optimizing the protein for the target property. [12] A critical distinction from natural evolution is that the selection pressure is decoupled from organismal fitness; the sole objective is the optimization of a single, specific protein property defined by the experimenter. [12]
Figure 1: The iterative directed evolution cycle. The process begins with a parent gene and proceeds through repeated rounds of diversification, screening, and analysis until a protein with the desired enhanced properties is obtained.
Methodologies for Genetic Diversification
The creation of a diverse library of gene variants is the foundational step that defines the boundaries of explorable sequence space. [12] The quality, size, and nature of this diversity directly constrain the potential outcomes of the entire evolutionary campaign. Several methods have been developed to introduce genetic variation, each with distinct advantages, limitations, and inherent biases.
Random Mutagenesis Techniques
Error-Prone PCR (epPCR) is the most established and widely used method for random mutagenesis. [12] This technique is a modified PCR that intentionally reduces the fidelity of DNA polymerase, thereby introducing errors during gene amplification. This is typically achieved by using a polymerase lacking 3' to 5' proofreading activity, creating an imbalance in dNTP concentrations, and adding manganese ions (Mn²⁺) to the reaction. [12] The concentration of Mn²⁺ can be precisely controlled to tune the mutation rate, which is typically targeted to 1–5 base mutations per kilobase, resulting in an average of one or two amino acid substitutions per protein variant. [12]
While powerful and straightforward, epPCR is not truly random. DNA polymerases have an intrinsic bias that favors transition mutations over transversion mutations. This bias, combined with the degeneracy of the genetic code, means that at any given amino acid position, epPCR can only access an average of 5–6 of the 19 possible alternative amino acids, constraining the accessible sequence space. [12]
Recombination-Based Methods
To overcome the limitations of point mutagenesis and mimic natural sexual recombination, methods based on gene shuffling were developed. These techniques allow for the combination of beneficial mutations from multiple parent genes into a single, improved offspring. [12]
DNA Shuffling (or "sexual PCR"), pioneered by Willem P. C. Stemmer, involves randomly fragmenting one or more related parent genes using DNaseI. These small fragments are then reassembled in a PCR reaction without added primers. During the annealing step, homologous fragments from different parental templates can overlap and prime each other for extension, resulting in crossovers that shuffle genetic information and create chimeric genes with novel combinations of mutations. [12]
Family Shuffling applies the DNA shuffling protocol to a set of homologous genes isolated from different species. By drawing from nature's standing variation, family shuffling provides access to a much broader and more functionally relevant region of sequence space than mutating a single gene, significantly accelerating the rate of functional improvement. [12] The primary limitation of recombination-based methods is their requirement for sequence homology (typically 70–75% identity) between parental genes for efficient reassembly. [12]
Focused and Semi-Rational Mutagenesis
When structural or functional information is available, focused mutagenesis targeting specific regions or residues can create smaller, higher-quality libraries. [12]
Site-Saturation Mutagenesis comprehensively explores the functional importance of one or a few amino acid positions, often "hotspots" identified from prior random mutagenesis or structural predictions. At the target codon, a library is created that encodes all 19 other possible amino acids, allowing for deep, unbiased interrogation of a residue's role. [12] This semi-rational approach dramatically increases the efficiency of directed evolution by reducing library size and increasing the frequency of beneficial variants. [11] [12]
Table 1: Comparison of Key Genetic Diversification Methods
| Method | Principle | Advantages | Disadvantages | Therapeutic Application Examples |
|---|---|---|---|---|
| Error-Prone PCR [12] | Introduces random point mutations during PCR amplification | Easy to perform; no prior knowledge of structure needed; wide mutational distribution | Biased mutational spectrum (5-6 amino acids accessible per position); reduced sequence space sampling | Engineering of therapeutic antibodies for enhanced affinity [11] |
| DNA Shuffling [12] | Recombines fragments of homologous genes | Combines beneficial mutations; mimics natural recombination | Requires high sequence homology (>70%); biased crossover frequency | Generation of diverse antibody libraries [11] |
| Site-Saturation Mutagenesis [12] | Systematically randomizes specific codons to all possible amino acids | Comprehensive exploration of key positions; efficient for hot spots | Requires structural knowledge or prior data; limited to focused regions | Affinity maturation of binding proteins; optimizing enzyme active sites [11] |
| Orthogonal Replication Systems [13] | Uses specialized, error-prone DNA polymerases for in vivo mutagenesis | Continuous in vivo mutation; restricted to target plasmid | Lower mutation frequency; size limitations on target sequence | Evolving dihydrofolate reductase and orotidine-5'-phosphate decarboxylase [13] |
High-Throughput Screening and Selection Platforms
The central challenge of directed evolution is identifying rare improved variants from a population dominated by neutral or non-functional mutants. This genotype-to-phenotype linkage represents the primary bottleneck in the process, with success dictated by the axiom, "you get what you screen for." [12] The power and throughput of the screening platform must match the size and complexity of the generated library.
A key distinction exists between screening and selection. Screening involves individual evaluation of every library member for the desired property, providing quantitative data on performance but with limited throughput. Selection establishes a system where desired function directly couples to host survival or replication, automatically eliminating non-functional variants and enabling assessment of much larger libraries (>10¹¹ variants). [11] [14]
Figure 2: Decision framework for screening and selection methodologies. Selection methods typically offer higher throughput, while screening methods provide more quantitative data on variant performance.
Screening Methodologies
Microtiter Plate-Based Screening utilizes 96-, 384-, or even 1536-well plates to miniaturize enzyme assays. [14] These platforms enable colorimetric or fluorometric assays where substrate disappearance or product formation is measured spectrophotometrically. While throughput is improved with robotic systems, these methods remain limited compared to other approaches and often require specific substrate properties. [14] Recent advancements like the Biolector system allow online monitoring of light scatter and NADH fluorescence signals, enabling screening of cellulase and protease activities. [14]
Fluorescence-Activated Cell Sorting (FACS) provides ultrahigh-throughput screening at rates up to 30,000 cells per second based on the fluorescent signals of individual cells. [14] [15] FACS applications in directed evolution include:
- GFP-Reporter Assays: Coupling target enzyme activity with GFP expression. [14]
- Product Entrapment: Using fluorescent substrates that are converted to products retained within cells, enabling screening based on accumulated fluorescence. [14] This approach identified a glycosyl-transferase variant with 400-fold enhanced activity for fluorescent selection substrates. [14]
- Cell Surface Display: Combining with display technologies where enzymes displayed on cell surfaces catalyze attachment of fluorescent substrates to the cell. [14] One system achieved 6,000-fold enrichment of active clones after a single round of screening. [14]
Digital Imaging (DI) allows solid-phase screening of colonies via single pixel imaging spectroscopy, particularly useful for screening enzyme variants on problematic substrates. [14] In one application for transglycosidase evolution, DI enabled identification of variants with a 70-fold improvement in transglycosidase/hydrolysis activity ratio. [14]
Selection Methodologies
Display Technologies physically link the translated protein to its encoding gene, making protein libraries accessible to external environments for selection. Phage display, developed by George Smith and honored with the 2018 Nobel Prize, fuses exogenous sequences to phage coat proteins, enabling selection of binding proteins through affinity purification. [11] Similar principles apply to yeast surface display and bacterial surface display, each offering different advantages for eukaryotic protein processing and throughput. [14]
In Vivo Selection couples the desired enzyme activity to host cell survival, either by enabling synthesis of vital metabolites or destroying toxins. [11] Such systems are generally limited only by transformation efficiency, making them less expensive and labor-intensive than screening, though they can be difficult to engineer and prone to artifacts. [11]
In Vitro Compartmentalization (IVTC) uses water-in-oil emulsion droplets or double emulsions to isolate individual DNA molecules, creating independent reactors for cell-free protein synthesis and enzyme reactions. [14] This approach circumvents the regulatory networks of in vivo systems and eliminates transformation efficiency limitations on library size. [14] When combined with FACS or microbeads, IVTC enables ultrahigh-throughput screening, as demonstrated by identification of β-galactosidase mutants with 300-fold higher kcat/KM values than wild-type enzyme. [14]
Table 2: High-Throughput Screening and Selection Platforms
| Platform | Throughput | Key Principle | Advantages | Limitations |
|---|---|---|---|---|
| Microtiter Plates [14] | ~10²–10⁴ variants | Colorimetric/fluorometric assays in multi-well formats | Adapts traditional assays; automation compatible | Low throughput relative to other methods; requires assay development |
| FACS [14] [15] | Up to 30,000 cells/sec | Fluorescence-based sorting of individual cells | Ultrahigh throughput; quantitative; multiple parameter sorting | Requires fluorescence signal; instrument access needed |
| Digital Imaging [14] | ~10⁴–10⁵ colonies | Solid-phase screening via imaging spectroscopy | Adapts colorimetric assays; spatial information | Limited to certain assay types; resolution challenges |
| Phage/Yeast Display [11] [14] | >10¹¹ variants | Physical linkage of protein to encoding gene | Extremely high throughput; direct selection for binding | Primarily for binding proteins; not direct activity measurement |
| In Vitro Compartmentalization [14] | >10¹⁰ variants | Water-in-oil emulsion droplets compartmentalize genes | Bypasses cellular transformation; flexible conditions | Can be technically challenging; compatibility issues |
Application Notes: Protocol for Ultrahigh-Throughput Directed Evolution
Temperature-Controlled Continuous Evolution System
This protocol describes an in vivo continuous directed evolution system with thermosensitive inducible tunability, based on error-prone DNA polymerase I (Pol I) expression modulated by an engineered thermal-responsive repressor and genomic MutS mutation in *Escherichia coli. [15]
Materials and Reagents
- Plasmid System: pSC101 (low-copy mutator plasmid with Pol I* under PR promoter) and pET28a (multicopy target plasmid with ColE1 ori) [15]
- Bacterial Strain: E. coli BL21 (DE3) with temperature-sensitive MutS defect [15]
- Thermal-Responsive Repressor: Engineered cI857* repressor variant with improved temperature sensitivity [15]
- Selection Media: LB medium with appropriate antibiotics (carbenicillin for β-lactamase selection) [15]
Experimental Procedure
Step 1: System Construction
- Clone the gene of interest (GOI) into the pET28a-derived target plasmid downstream of ColE1 origin of replication.
- Co-transform the mutator plasmid (pSC101-cI857-λPR-Pol I) and target plasmid into E. coli BL21 (DE3) MutS mutant competent cells.
- Plate transformed cells on double antibiotic selection plates and incubate at 30°C overnight.
Step 2: Temperature-Induced Mutagenesis
- Inoculate single colonies into liquid LB medium with appropriate antibiotics.
- Grow cultures at permissive temperature (30°C) until mid-log phase (OD600 ≈ 0.6).
- Shift culture temperature to 37–42°C for 4–8 hours to induce Pol I* expression and initiate mutagenesis.
- Maintain cultures at elevated temperature with shaking (220 rpm) for mutagenesis period.
Step 3: Functional Selection or Screening
- For selectable traits (e.g., antibiotic resistance): Plate mutagenized cells on selective media containing the target antibiotic at appropriate concentrations. Isolate resistant colonies for further analysis. [15]
- For non-selectable traits: Employ ultrahigh-throughput screening methods:
- FACS with Biosensors: For metabolic pathway enzymes, use transcription factor-based biosensors that regulate fluorescent protein expression in response to metabolite concentration. [15]
- Microfluidic Droplet Screening: For secretory enzymes, encapsulate single cells in picoliter droplets with fluorescent substrates and sort based on activity. [15]
Step 4: Iterative Enrichment
- Israte plasmid DNA from selected variants or pools.
- Use as template for subsequent evolution cycles or characterize individual clones.
- Repeat cycles (Steps 2-4) until desired functional improvement is achieved.
Key Validation Results
This system demonstrated an approximately 600-fold increase in targeted mutation rate compared to baseline. [15] When applied to α-amylase evolution coupled with microfluidic droplet screening, variants with 48.3% improved activity were identified. [15] For the resveratrol biosynthetic pathway coupled with FACS-based biosensing, producers with 1.7-fold higher resveratrol titers were selected. [15]
The Scientist's Toolkit: Essential Research Reagents
Table 3: Key Research Reagent Solutions for Directed Evolution
| Reagent/Resource | Function | Application Notes |
|---|---|---|
| Error-Prone PCR Kit | Introduces random mutations during amplification | Commercial kits available; optimize Mn²⁺ concentration for desired mutation rate [12] |
| Taq DNA Polymerase | Low-fidelity PCR amplification | Lacks 3'→5' proofreading; essential for error-prone PCR [12] |
| DNase I | Randomly fragments DNA for shuffling | Used in DNA shuffling protocols to generate random fragments [12] |
| Microtiter Plates | High-throughput assay format | 96-well to 1536-well formats for screening; compatible with automation [14] |
| Fluorescent Substrates | Enzyme activity detection | Enable FACS-based screening and product entrapment strategies [14] |
| Water-in-Oil Emulsion Reagents | In vitro compartmentalization | Create artificial compartments for IVC screening [14] |
| Phage/Yeast Display Vectors | Genotype-phenotype linkage | Display proteins on surface for binding selection [11] [14] |
| Temperature-Sensitive Repressor (cI857*) | Regulates mutator expression | Engineered variant provides lower leakage and higher induction [15] |
Directed evolution represents a powerful paradigm for protein engineering that has matured into an essential technology for therapeutic development. By harnessing high-throughput mutagenesis and selection, researchers can navigate vast sequence landscapes to optimize proteins for therapeutic applications including antibodies, enzymes, and biosynthetic pathways. The continued development of ultrahigh-throughput screening technologies, combined with innovative in vivo continuous evolution platforms, promises to further accelerate the engineering of novel protein therapeutics. As the field advances, integration of machine learning and computational design with directed evolution approaches will likely create synergistic strategies for navigating protein fitness landscapes more efficiently, ultimately expanding the toolbox available for protein-based therapeutic engineering.
The field of protein engineering is undergoing a revolutionary transformation, moving beyond the constraints of natural evolution toward the rational creation of entirely novel proteins. De novo protein design refers to the computational generation of new proteins with sequences and structures not found in nature, enabling atom-level precision in synthetic biology [6]. This approach has profound implications for protein-based therapeutics engineering, offering solutions to previously intractable challenges in drug discovery and development. Unlike conventional protein engineering that modifies existing biological templates, de novo design employs first-principle rational engineering to create functional modules unbound by evolutionary constraints [6] [16]. The integration of artificial intelligence (AI) has dramatically accelerated this field, with deep learning methods now enabling researchers to explore the vast "protein functional universe" – the theoretical space encompassing all possible protein sequences, structures, and their biological activities [16].
The commercial and therapeutic impact of these advancements is substantial. Protein-engineered products currently constitute a market approaching $400 billion, with projections suggesting the sector will exceed $500 billion by 2035 [1] [2]. In therapeutics, engineered proteins dominate the biologics market, from monoclonal antibodies to next-generation insulin analogs [2]. This review presents a structured framework for de novo protein design, providing detailed application notes and experimental protocols to empower researchers in leveraging these computational breakthroughs for therapeutic innovation.
Core Computational Architectures and Design Principles
The computational pipeline for de novo protein design typically follows a multi-stage process, with recent AI-driven approaches significantly enhancing capabilities at each step. The foundational aspects include backbone conformation design, sequence sampling, scoring, and functional site design [17] [18].
Traditional Physics-Based Frameworks
Before the AI revolution, de novo protein design relied heavily on physics-based modeling approaches. The Rosetta software suite exemplifies this paradigm, operating on Anfinsen's hypothesis that proteins fold into their lowest-energy state [17]. Rosetta employs fragment assembly and force-field energy minimization to fold proteins in silico, stitching together short peptide fragments from known proteins and performing conformational sampling through methods like Monte Carlo with simulated annealing [17] [18]. The lowest-energy conformations under its force field are selected as candidate designs. In 2003, this approach produced Top7, a 93-residue protein with a novel fold not observed in nature [17]. Despite its successes, Rosetta exhibits limitations including approximate force fields that can marginal inaccuracies leading to misfolded designs, and considerable computational expense that restricts thorough sampling of sequence-structure space [16].
AI-Driven Methodologies
Deep learning has transformed protein design by learning fundamental features of protein structures from vast biological datasets. ProteinMPNN, a message-passing neural network, has revolutionized sequence design by achieving a 52.4% sequence recovery rate on native protein backbones, significantly outperforming Rosetta's 32.9% [18]. The model works by autoregressively predicting protein sequences when provided with protein backbone coordinates as input, accurately designing single or multiple chains for diverse protein design challenges [18].
RFdiffusion represents a groundbreaking advancement in structure generation. By fine-tuning the RoseTTAFold structure prediction network on protein structure denoising tasks, RFdiffusion functions as a generative model that creates protein backbones through a diffusion process [19]. Similar to AI models that generate images from text prompts, RFdiffusion starts with amino acid residue noise and iteratively "denoises" it to produce novel protein structures [19] [18]. This approach has demonstrated exceptional performance across diverse design challenges including unconditional protein monomer generation, protein binder design, symmetric oligomer design, and enzyme active site scaffolding [19].
Table 1: Key Computational Tools for De Novo Protein Design
| Tool | Methodology | Primary Application | Performance Characteristics |
|---|---|---|---|
| Rosetta | Physics-based fragment assembly and energy minimization | Novel fold generation, enzyme design | 32.9% sequence recovery; limited by force field approximations |
| ProteinMPNN | Message-passing neural network | Sequence design for backbone structures | 52.4% sequence recovery; handles single/multiple chains |
| RFdiffusion | Diffusion model fine-tuned on RoseTTAFold | De novo backbone generation, binder design | High success rate experimentally validated; enables conditional generation |
| Frame2seq | Structure-conditioned masked language model | Sequence design | Outperforms ProteinMPNN by 2% in sequence recovery; 6x faster inference |
Experimental Protocols for Computational Design Validation
Computational designs require rigorous experimental validation to confirm structural accuracy and functional efficacy. The following protocols outline standardized methodologies for characterizing de novo designed proteins.
Structural Validation Protocol
Objective: Confirm that the experimentally determined structure matches the computational design model.
Materials:
- Purified designed protein (≥0.5 mg/mL concentration)
- Crystallization screening kits (commercial screens sufficient)
- Cryo-EM grids (quantifoil or similar)
- Circular dichroism (CD) spectrometer
- Size exclusion chromatography (SEC) system
Methodology:
Initial Biophysical Characterization:
- Perform CD spectroscopy to assess secondary structure composition. Compare the experimental spectra with computational predictions.
- Conduct thermal denaturation studies via CD to determine melting temperature (Tₘ), indicating stability.
- Use SEC to evaluate oligomeric state and monodispersity.
High-Resolution Structure Determination:
- Attempt crystallization using vapor diffusion methods with commercial sparse matrix screens.
- For proteins recalcitrant to crystallization, proceed with single-particle cryo-EM:
- Apply 3-4 μL protein solution to glow-discharged grids
- Blot and plunge-freeze in liquid ethane
- Collect datasets on a 300 keV microscope
- Process data using standard pipelines (cryoSPARC or RELION)
- For the design of protein binders, form complexes with targets prior to structural studies.
Validation Metrics:
- Calculate backbone root-mean-square deviation (RMSD) between design model and experimental structure
- Assess predicted aligned error (pAE) using AlphaFold2 or similar tools
- For functional sites, ensure ≤1.0 Å RMSD on scaffolded regions
Expected Outcomes: Successful designs typically show <2.0 Å global backbone RMSD to design models and high confidence (mean pAE <5) in AF2 predictions [19]. RFdiffusion-generated designs have confirmed these metrics, with cryo-EM structures of designed binders nearly identical to design models [19].
Functional Screening in Synthetic Cell Mimics
Objective: Evaluate emergent functions (e.g., spatiotemporal patterning) in a controlled environment.
Materials:
- Cell-free protein expression system (PURExpress or similar)
- Lipid mixtures (DOPC, DOPE, DOPS)
- Microfluidics device for droplet generation
- Total internal reflection fluorescence (TIRF) microscope
- ATP regeneration system
Methodology:
Protein Generation:
- Express designed proteins using cell-free system
- Purify via affinity chromatography if necessary
Synthetic Cell Assembly:
- Form giant unilamellar vesicles (GUVs) or water-in-oil droplets
- Incorporate protein components into lipid compartments
- Add ATP regeneration system to maintain energy levels
Functional Imaging:
- Monitor spatiotemporal dynamics via TIRF microscopy
- Quantify pattern formation parameters (oscillation frequency, wavelength)
- Compare with computational predictions of emergent behavior
Applications: This protocol has successfully screened ML-generated variants of the bacterial MinDE system for biological pattern formation, identifying candidates that functionally substitute for wild-type proteins in E. coli [20].
Figure 1: Experimental Validation Workflow for De Novo Designed Proteins
Implementation Framework for Therapeutic Applications
The translation of computational designs into therapeutic candidates requires specialized approaches to address the unique demands of medical applications.
Safety and Immunogenicity Assessment Protocol
De novo designed proteins introduce unique biosafety considerations as structurally unprecedented proteins may pose risks including immune reactions, cellular pathway disruptions, and environmental persistence [6].
Objective: Systematically evaluate safety profiles of designed protein therapeutics.
Materials:
- Dendritic cells and T-cells from human donors
- ELISA kits for cytokine detection
- Complement activation assay kits
- Predictive immunogenicity software (EpiMatrix or similar)
Methodology:
In Silico Immunogenicity Screening:
- Scan sequences for potential T-cell epitopes using MHC binding prediction algorithms
- Identify sequence motifs associated with immunogenicity
- Re-design regions with high epitope density while maintaining function
In Vitro Safety Profiling:
- Expose human dendritic cells to designed proteins
- Measure T-cell activation and cytokine release
- Assess complement activation potential
- Evaluate tissue factor activation for thrombosis risk
Mitigation Strategies:
- Implement humanization protocols for non-human derived designs
- Incorporate glycosylation sites to shield immunogenic regions
- Optimize stability to reduce aggregation potential
Design Considerations: Therapeutic proteins must balance innovation with biocompatibility. Strategic mutations can enhance stability and reduce immunogenicity, as demonstrated by Fc domain variants (M428L/N434S) that extend circulation half-life in approved therapeutics like ravulizumab [1].
Specialized Design Cases for Therapeutics
Table 2: Design Strategies for Specific Therapeutic Applications
| Therapeutic Class | Design Approach | Computational Tools | Validation Methods |
|---|---|---|---|
| Protein Binders | Scaffold functional sites complementary to target | RFdiffusion with target conditioning | Surface plasmon resonance, cryo-EM complex structure |
| Enzymes | Active site scaffolding with precise geometry | RFdiffusion, Rosetta | Activity assays, kinetics measurements |
| Signaling Modulators | Multi-state design for conformational switching | Molecular dynamics, MSA-VAE | Cell-based assays, synthetic cell screening |
| Self-assembling Therapeutics | Symmetric oligomer design | RFdiffusion symmetric oligomer mode | Electron microscopy, analytical ultracentrifugation |
Essential Research Reagent Solutions
Successful implementation of de novo protein design requires specialized reagents and computational resources. The following toolkit outlines critical components for establishing a design pipeline.
Table 3: Essential Research Reagent Solutions for De Novo Protein Design
| Category | Specific Items | Function/Purpose | Examples/Suppliers |
|---|---|---|---|
| Computational Resources | GPU clusters | Accelerate neural network inference | NVIDIA A100, H100 |
| Cloud computing platforms | Provide access to specialized hardware | Google Cloud, AWS | |
| Software Tools | Protein design suites | Structure generation and sequence design | RFdiffusion, ProteinMPNN, Rosetta |
| Structure prediction | Validation of designs | AlphaFold2, ESMFold | |
| Experimental Materials | Cell-free expression systems | Rapid protein prototyping | PURExpress, NEBExpress |
| Crystallization screens | Structural validation | Hampton Research, Molecular Dimensions | |
| Lipid mixtures | Synthetic cell formation for functional screening | Avanti Polar Lipids | |
| Analytical Instruments | Circular dichroism spectrometer | Secondary structure assessment | Jasco, Applied Photophysics |
| Surface plasmon resonance | Binding affinity measurement | Biacore, Nicoya | |
| Cryo-electron microscope | High-resolution structure determination | Thermo Fisher, JEOL |
De novo computational protein design has matured from an academic pursuit to a powerful framework for creating novel therapeutics with precision and efficiency. The integration of deep learning methodologies like RFdiffusion and ProteinMPNN has dramatically expanded the accessible region of protein structure space, enabling the creation of proteins with customized functions beyond natural evolutionary boundaries [19] [16]. As these technologies continue to evolve, several emerging trends promise to further transform the field.
The development of "all-atom" versions of diffusion models will enhance small-molecule binder design, generating unique binding pockets for therapeutic targets [18]. Additionally, conditional generation approaches that incorporate non-protein components (DNA, small molecules) will enable more sophisticated multi-state designs for complex therapeutic functions [20]. The emerging paradigm of closed-loop design, combining computational generation with high-throughput experimental screening and machine learning refinement, will accelerate the optimization of therapeutic candidates [6] [20].
For research and development organizations, strategic investment in the computational infrastructure and specialized expertise required for these methodologies will be essential to maintain competitive advantage in the evolving landscape of protein therapeutics. The organizations that successfully integrate these advanced computational design capabilities with rigorous experimental validation will be positioned to lead the next wave of innovation in biologic therapeutics, addressing currently untreatable diseases through proteins unlike anything found in nature.
The landscape of protein-based therapeutics has expanded significantly beyond conventional monoclonal antibodies to include advanced formats such as alternative protein scaffolds and engineered receptor systems. These platforms offer distinct advantages in targeting capability, tissue penetration, and programmability for therapeutic applications. Antibodies continue to dominate the biologic market with 144 FDA-approved products and 1,516 candidates in clinical development as of 2025, demonstrating their established role in treating oncology, immunology, and infectious diseases [21]. Emerging alternative scaffolds including DARPins, affibodies, and nanobodies provide compact architectures with enhanced tissue penetration and stability profiles. Meanwhile, newly developed engineered receptors such as SNIPRs (Synthetic Intramembrane Proteolysis Receptors) enable cells to detect soluble ligands with unprecedented precision, opening new possibilities for programmable cellular therapies [22] [23]. The global protein therapeutics market reflects this innovation, projected to grow from $441.7 billion in 2024 to $655.7 billion by 2029 at a compound annual growth rate of 8.2% [24].
Table 1: Key Platforms in Protein-Based Therapeutics
| Platform | Key Characteristics | Primary Applications | Notable Examples |
|---|---|---|---|
| Monoclonal Antibodies | High specificity, ~150 kDa, established manufacturing | Oncology, autoimmune diseases, infectious diseases | Pembrolizumab (Keytruda), Adalimumab (Humira) [21] |
| Bispecific Antibodies | Simultaneous binding to two antigens, immune cell redirection | Oncology, hematological malignancies | Blinatumomab, Tarlatamab [21] [25] |
| Antibody-Drug Conjugates | Targeted cytotoxic delivery, antibody-small molecule hybrids | Oncology, targeted therapy | Sacituzumab tirumotecan, Trastuzumab deruxtecan [21] [25] |
| Alternative Scaffolds | Compact size (<50 kDa), high stability, deep tissue penetration | Oncology, molecular imaging, difficult-to-drug targets | DARPins, Affibodies, Nanobodies [26] |
| Engineered Receptors | Soluble ligand detection, programmable cellular responses | Cell therapies, synthetic biology, precision oncology | SNIPRs, OrthoSNIPRs [22] [23] |
Antibodies and Alternative Scaffolds: Applications and Quantitative Comparison
Monoclonal antibodies (mAbs) have evolved significantly from their murine origins to fully human formats, reducing immunogenicity while maintaining target specificity. Technological advances in antibody discovery including phage display, transgenic mouse platforms, and single B cell screening have dramatically accelerated the development timeline [21]. The commercial impact is substantial, with therapeutic antibodies achieving global sales exceeding $267 billion in 2024 [21]. Key innovations include antibody-drug conjugates (ADCs) that deliver cytotoxic payloads specifically to tumor cells, and bispecific antibodies that redirect immune effector cells to target cancer cells, exemplified by blinatumomab's success in treating acute lymphoblastic leukemia [21] [27].
Alternative protein scaffolds represent a distinct class of targeting molecules engineered from non-immunoglobulin proteins. These scaffolds offer several advantages over conventional antibodies, including smaller size (typically 10-20 kDa versus 150 kDa for IgG), robust stability (thermal resilience with Tm >70°C), and efficient tissue penetration [26]. Their compact architectures enable targeting of cryptic epitopes inaccessible to bulkier antibodies, while their single-domain nature simplifies genetic manipulation and production in microbial systems [26]. DARPins (Designed Ankyrin Repeat Proteins) demonstrate exceptional thermal stability (Tm >90°C) derived from engineered consensus sequences with optimized hydrophobic cores and hydrogen bonding networks [26]. Similarly, affibodies based on three-helix bundle domains exhibit remarkable chemical stability, making them suitable for harsh diagnostic and therapeutic environments [26].
Table 2: Quantitative Comparison of Therapeutic Protein Formats
| Parameter | Conventional mAbs | Bispecific Antibodies | Alternative Scaffolds | Engineered Receptors |
|---|---|---|---|---|
| Molecular Size | ~150 kDa | ~150-200 kDa | <50 kDa | Varies by design |
| Production System | Mammalian cells | Mammalian cells | Microbial or mammalian | Mammalian cells |
| Thermal Stability (Tm) | ~65-70°C | ~65-70°C | >70°C (up to >90°C for DARPins) | Varies by design |
| Tissue Penetration | Moderate | Moderate | High | Cell-based |
| Development Timeline | 6-9 months (discovery) | 9-12 months (discovery) | 3-6 months (discovery) | Varies by complexity |
| Approved Therapeutics | 144 (FDA) | 6 (as of 2024) | In clinical trials | Preclinical/early clinical |
| Market Impact | $267 billion (2024 sales) | Growing segment | Emerging segment | Emerging segment |
Experimental Protocol: Engineering Affibodies for Tumor Targeting
Objective: Engineer affibody molecules targeting HER2 with high affinity and specificity for molecular imaging applications.
Materials:
- Phage display library of affibody variants
- HER2 extracellular domain (ECD)
- E. coli expression system (BL21(DE3) strains)
- Surface plasmon resonance (SPR) system
- Animal tumor xenograft models
Methodology:
- Library Construction: Generate affibody variant library through error-prone PCR of the Z domain of protein A, focusing on randomized positions within the helical binding interface.
- Panning Selections: Perform three rounds of phage display selection against immobilized HER2 ECD. Include counter-selection against related EGFR family members to enhance specificity.
- Expression and Purification: Clone selected variants into pET vector system. Express in E. coli BL21(DE3) and purify using immobilized metal affinity chromatography (IMAC).
- Affinity Measurement: Characterize binding kinetics using SPR with HER2 ECD immobilized on CM5 chip. Use multi-cycle kinetics with concentrations ranging from 0.1 nM to 100 nM.
- Specificity Profiling: Validate specificity using cross-reactivity assays against human proteome arrays and cell lines expressing different EGFR family members.
- In Vivo Validation: Label purified affibodies with ^68Ga for PET imaging. Administer to mice bearing HER2-positive and HER2-negative tumor xenografts. Image at 1, 2, and 4 hours post-injection.
Expected Outcomes: Successful affibody variants should demonstrate sub-nanomolar affinity (KD < 1 nM) for HER2, high specificity (>100-fold selectivity over related receptors), and rapid tumor uptake in animal models with high tumor-to-background ratios (>3:1) within 2 hours post-injection [26].
Engineered Ligands and Receptors: The SNIPR Platform
The SNIPR (Synthetic Intramembrane Proteolysis Receptor) platform represents a breakthrough in synthetic biology, enabling engineered cells to detect soluble ligands with high precision and activate custom therapeutic programs [22]. This technology addresses a critical gap in cellular engineering by creating compact, single-chain receptors that respond robustly to soluble factors—a capability that eluded earlier systems like synNotch [22]. The SNIPR architecture employs an endocytic, pH-dependent cleavage mechanism where ligand binding triggers receptor internalization into acidic endosomes, followed by γ-secretase-mediated proteolytic release of a transcription factor that migrates to the nucleus to activate downstream genes [23].
SNIPRs demonstrate remarkable versatility by sensing both physiological and synthetic ligands. Researchers have engineered SNIPRs to recognize various soluble factors including TGF-β, VEGF, FGF2, and IFN-γ, with primary human T cells showing robust ligand-specific activation and minimal baseline activity [22]. For example, TGF-β SNIPRs achieved a 40-fold induction of reporter genes upon ligand exposure, surpassing the performance of earlier technologies [23]. Notably, these receptors can distinguish between different forms of ligands, such as active versus latent TGF-β, which is particularly important for tumor microenvironment detection where the active form drives immunosuppression [23].
A landmark application of SNIPRs is their integration with CAR T-cell therapies to mitigate on-target, off-tumor toxicity. In mouse xenograft models, SNIPR-CAR T cells activated only in the presence of appropriate tumor-derived soluble factors like TGF-β or VEGF [23]. This approach eliminated lethal weight loss observed with constitutive CARs that attacked healthy tissues expressing low antigen levels. In lung adenocarcinoma models, SNIPR-CAR T cells suppressed tumor growth without systemic toxicity, whereas conventional CARs caused fatal cytokine release syndrome [22] [23].
Figure 1: SNIPR Activation Mechanism. Soluble ligand binding triggers receptor internalization into acidic endosomes, where pH-dependent γ-secretase cleavage releases a transcription factor that translocates to the nucleus to activate therapeutic gene programs.
Experimental Protocol: Engineering SNIPR-Modified T Cells for Solid Tumors
Objective: Engineer primary human T cells expressing SNIPR receptors responsive to TGF-β for restricted activation in the tumor microenvironment.
Materials:
- Primary human CD3+ T cells from healthy donors
- Lentiviral vectors encoding TGF-β SNIPR (anti-TGF-β scFv-TM-TF)
- Recombinant active TGF-β, VEGF, FGF2, IFN-γ
- γ-secretase inhibitor (DAPT, 10 μM)
- Flow cytometry equipment and BFP reporter assay
- NSG mice with patient-derived xenografts
Methodology:
- SNIPR Construct Design: Clone anti-TGF-β scFv (1D11) into SNIPR backbone with CD8α transmembrane domain and GAL4-VP64 transcription factor. Include BFP reporter under UAS promoter.
- Lentiviral Production: Generate lentivirus in HEK293T cells using psPAX2 and pMD2.G packaging plasmids. Concentrate virus by ultracentrifugation.
- T Cell Activation and Transduction: Isolate CD3+ T cells from human PBMCs using Ficoll gradient. Activate with CD3/CD28 beads for 48 hours. Transduce with lentivirus at MOI 10 in the presence of 8 μg/mL polybrene.
- In Vitro Validation: Stimulate transduced T cells with recombinant TGF-β (0.1-10 ng/mL) and control cytokines. Assess BFP expression by flow cytometry at 24-48 hours. Test specificity using related cytokines.
- Mechanism Validation: Pre-treat T cells with γ-secretase inhibitor DAPT (10 μM, 2 hours) to confirm cleavage-dependent activation.
- In Vivo Testing: Inject SNIPR-T cells into NSG mice bearing TGF-β-secreting lung adenocarcinoma xenografts. Monitor tumor volume twice weekly and assess systemic toxicity by weight loss and cytokine release syndrome criteria.
Expected Outcomes: TGF-β SNIPR T cells should demonstrate specific BFP reporter activation (≥40-fold induction) in response to active TGF-β but not latent TGF-β or control cytokines [22]. DAPT pretreatment should abolish activation, confirming γ-secretase dependence. In vivo, SNIPR-T cells should suppress tumor growth without the systemic toxicity observed with constitutive CAR T cells [23].
The Scientist's Toolkit: Essential Research Reagents
Table 3: Key Research Reagent Solutions for Protein Therapeutic Engineering
| Reagent/Category | Function/Application | Example Products/Specifications |
|---|---|---|
| scFv Phage Display Libraries | Generation of target-specific binding domains | Human scFv library, synthetic VH/VL repertoires |
| Directed Evolution Systems | Protein optimization through iterative mutation and selection | T7-ORACLE E. coli system [28], yeast surface display |
| Surface Plasmon Resonance | Binding kinetics characterization | Biacore systems, ProteOn XPR36 (affinity measurements) |
| Cell-Free Protein Synthesis | Rapid production of engineered scaffolds | E. coli-based CFPS kits with glycosylation modules [26] |
| Orthogonal Replication Systems | Continuous evolution of biomolecules | T7-ORACLE (100,000x higher mutation rate) [28] |
| Protein Stability Assays | Assessment of thermal and chemical stability | NanoDSF, Tycho NT.6 (measure Tm values) |
| Immunogenicity Prediction | In vitro assessment of potential immune responses | HLA-II epitope prediction algorithms, T cell activation assays [26] |
Emerging Technologies and Future Directions
The field of protein-based therapeutics continues to evolve with several emerging technologies poised to reshape the landscape. Artificial intelligence and machine learning have significantly accelerated protein design, allowing scientists to model protein structures and interactions with unprecedented accuracy [24]. AI-powered platforms are now optimizing stability, reducing immunogenicity, and enhancing the therapeutic potential of protein drugs through tools like AlphaFold-Multimer and RoseTTAFold, which enable de novo design of antibody scaffolds and binding interfaces [21].
Synthetic biology platforms represent another frontier, with systems like T7-ORACLE enabling continuous hypermutation and accelerated evolution of proteins thousands of times faster than nature [28]. This orthogonal replication system in E. coli introduces mutations into target genes at a rate 100,000 times higher than normal without damaging the host cells, dramatically accelerating the development timeline for therapeutic proteins [28]. The platform has demonstrated real-world relevance by rapidly evolving antibiotic resistance genes that match mutations found in clinical settings.
Advanced delivery systems are also transforming protein therapeutics. Next-generation approaches including nanocarriers, hydrogels, and cell-penetrating peptides enable proteins to reach specific tissues or cells, improving efficacy and minimizing side effects [24]. mRNA-lipid nanoparticle (LNP) technology has shown particular promise, enabling in vivo production of functional antibodies and bispecific antibodies that target tumor antigens [21]. This in situ expression strategy offers extended antibody half-life and the ability to bypass traditional manufacturing pipelines, accelerating drug development timelines and reducing production costs [21].
Figure 2: Technology Convergence in Protein Therapeutics. Integration of AI-driven design, accelerated evolution platforms, advanced delivery systems, and high-throughput screening enables development of next-generation protein therapeutics with enhanced properties and functionality.
Looking ahead, the landscape for protein drugs is set to become even more dynamic with several transformative trends. Personalized protein therapeutics leveraging advances in genomics and proteomics are paving the way for customized biologics tailored to individual patients [24]. Research into oral protein formulations could revolutionize administration, moving beyond injections to more patient-friendly delivery methods [24]. Synthetic biology integration is enabling the creation of entirely new protein modalities with enhanced therapeutic profiles, while global collaboration across nations, academic institutions, and private companies is expected to accelerate innovation and expand access to these advanced therapies [24].
Overcoming Hurdles: Strategies for Stability, Delivery, and Reduced Immunogenicity
Protein aggregation represents a fundamental obstacle in the development and commercialization of protein-based therapeutics. This process involves the undesirable association of individual protein molecules into larger, non-native structures, ranging from soluble oligomers to visible particles [29]. For researchers and drug development professionals, controlling aggregation is not merely a quality control checkpoint but is essential for ensuring product efficacy, safety, and stability throughout the product lifecycle [30] [29]. The stakes are high; aggregates can diminish therapeutic activity and, more critically, have the potential to trigger immunogenic responses in patients, compromising both treatment outcomes and patient safety [29] [31]. The stability of protein-based drugs is paramount during the entire manufacturing, storage, and delivery process. Structural instability arising from misfolding, unfolding, and various modifications can overshadow the promising therapeutic attributes of these biologics [30]. Furthermore, the biopharmaceutical landscape is evolving toward more complex modalities—including bispecific antibodies, antibody-drug conjugates (ADCs), and viral vectors—and higher concentration formulations (often exceeding 150 mg/mL for subcutaneous delivery). These trends intensify the challenges of managing aggregation and viscosity, demanding more sophisticated solution strategies [29].
Formulation Optimization Strategies
Formulation optimization serves as the first line of defense against protein aggregation. A well-designed formulation creates a stable environment that preserves the native conformation of the protein and minimizes associative interactions.
Key Excipients and Their Stabilizing Mechanisms
Excipients are additives included in the formulation to enhance stability. Their selection is critical and should be guided by an understanding of their mechanisms of action, which include preferential exclusion, surface activity, and direct interaction with the protein.
Table 1: Common Excipients for Preventing Protein Aggregation
| Excipient Category | Representative Examples | Primary Mechanism of Action | Typical Working Concentration |
|---|---|---|---|
| Sugars | Sucrose, Trehalose | Preferential exclusion, stabilizing native state [29] | 5-10% (w/v) |
| Polyols | Sorbitol, Mannitol | Preferential exclusion, molecular crowding [29] | 2-5% (w/v) |
| Surfactants | Polysorbate 20, Polysorbate 80 | Compete at interfaces, prevent surface-induced unfolding [29] | 0.01-0.1% (w/v) |
| Amino Acids | Arginine, Glycine, Proline | Complex effects; can suppress aggregation, though arginine may promote it in some cases [31] | 10-100 mM |
| Salts | Sodium Chloride, Sodium Sulfate | Modulate electrostatic interactions (can stabilize or destabilize) [29] | 50-150 mM |
| Osmolytes/Chemical Chaperones | Betaine, Trehalose | Stabilize native protein structure, aid in refolding [30] | Varies |
Protocol: High-Throughput Excipient Screening
Objective: To efficiently identify the most effective excipients and their optimal concentrations for stabilizing a specific therapeutic protein against aggregation.
Materials:
- Purified therapeutic protein
- 96-well or 384-well microplates (low protein binding)
- Liquid handling robot (manual pipetting is possible but less efficient)
- Stock solutions of excipients (e.g., sugars, surfactants, amino acids, salts)
- Buffer components (e.g., histidine, citrate, phosphate)
- Microplate sealer
- Stability chamber or incubator
- Dynamic Light Scattering (DLS) plate reader
- Microplate reader for fluorescence (e.g., Thioflavin T, SYPRO Orange) and turbidity measurements
Method:
- Design Excipient Matrix: Prepare a matrix of formulations that varies buffer type (e.g., histidine, citrate, phosphate), pH (e.g., pH 5.0, 6.0, 7.0), and a panel of excipients at different concentrations. A full factorial design is ideal but can be large; fractional factorial or D-optimal designs can reduce the number of conditions while maintaining statistical power.
- Preparation of Stock Solutions: Prepare concentrated stock solutions of all buffers and excipients. Sterile filter (0.22 µm) to ensure sterility.
- Formulation Dispensing: Using a liquid handler, dispense appropriate volumes of buffer and excipient stocks into the microplate wells to achieve the desired final concentrations. The final volume per well should be sufficient for the planned analytical techniques (typically 100-200 µL).
- Protein Addition: Dilute the purified therapeutic protein into each well to achieve the target concentration (e.g., 1-10 mg/mL). Gently mix without introducing air bubbles.
- Seal and Incubate: Seal the microplate to prevent evaporation and incubate under accelerated stress conditions (e.g., 40°C for 2-4 weeks) or real-time conditions (e.g., 2-8°C or 25°C for longer durations).
- Periodic Analysis: At predetermined time points (e.g., 0, 1, 2, 4 weeks), analyze the plates using the following techniques:
- Turbidity: Measure optical density at 350 nm or 600 nm to detect large, insoluble aggregates.
- DLS: Measure the hydrodynamic radius and polydispersity index to monitor the formation of soluble oligomers and subvisible particles.
- Fluorescence Spectroscopy:
- Thioflavin T (ThT): Add ThT to a final concentration of 10-20 µM. Measure fluorescence (excitation ~440 nm, emission ~480 nm) to detect amyloid-like fibrils.
- SYPRO Orange: Use to monitor thermal unfolding (via melt curves) as a proxy for conformational stability.
- Data Analysis: Consolidate data from all assays. Rank formulations based on minimal increase in turbidity, particle size, and ThT fluorescence, and maximal thermal stability.
High-Throughput Formulation Screening Workflow
Chemical Chaperones and Targeted Folding Correction
Beyond traditional excipients, chemical chaperones are a class of small molecules that can stabilize protein conformation, rescue misfolded proteins, and alleviate proteostasis imbalances. They function by promoting the correct folding of proteins within the cell, particularly in the endoplasmic reticulum (ER), and can stabilize proteins in formulation [30] [32].
Application of 4-Phenylbutyric Acid (4-PBA)
4-PBA is an FDA-approved chemical chaperone that has demonstrated efficacy in rescuing molecular defects caused by protein misfolding. A 2025 study on Vascular Ehlers-Danlos Syndrome (vEDS), caused by mutations in the COL3A1 gene, showed that 4-PBA could rescue ER stress, improve the thermostability of secreted collagen, and reduce associated cellular apoptosis and matrix defects [32]. The study indicated that treatment efficacy was influenced by dosage, duration, and allelic heterogeneity of the mutation [32].
Protocol: Evaluating Chemical Chaperones in Cell-Based Models of Protein Misfolding
Objective: To assess the ability of chemical chaperones like 4-PBA to reduce ER stress, improve secretion, and enhance the stability of a recombinantly expressed, aggregation-prone therapeutic protein.
Materials:
- Mammalian cell line (e.g., HEK293, CHO) expressing the target protein
- Cell culture medium and supplements
- Chemical chaperone stock solutions (e.g., 500 mM 4-PBA in DMSO or PBS)
- Dimethyl sulfoxide (DMSO) for vehicle control
- Cell culture plates (6-well, 96-well)
- Lysis buffer (containing protease inhibitors)
- BCA or Bradford protein assay kit
- SDS-PAGE and Western blot equipment
- Antibodies for target protein, ER stress markers (BiP/GRP78, p-eIF2α, CHOP), and loading control (e.g., GAPDH, β-Actin)
- ELISA kit for quantifying secreted target protein
- Trypsin (for thermostability assay)
Method:
- Cell Seeding and Treatment:
- Seed cells expressing the target protein in 6-well plates (for protein analysis) and 96-well plates (for viability assays) at an appropriate density.
- After cell attachment, treat with various concentrations of the chemical chaperone (e.g., 0.1 mM, 1 mM, 10 mM 4-PBA). Include a vehicle control (DMSO at the same dilution as the highest chaperone concentration) and an untreated control.
- Incubate cells for 24-72 hours. Medium containing the chaperone should be refreshed every 24 hours for chronic studies.
Cell Viability Assay (MTT/XTT):
- At the end of the treatment period, assess cell viability in the 96-well plates using an MTT or XTT assay according to the manufacturer's instructions to ensure the chaperone concentrations are not cytotoxic.
Sample Collection:
- Conditioned Medium: Collect the culture medium and centrifuge to remove any floating cells or debris. Aliquot and store at -80°C for analysis of secreted protein.
- Cell Lysates: Wash the cells in 6-well plates with PBS. Lyse the cells using an appropriate lysis buffer. Centrifuge the lysates to remove insoluble material and determine the protein concentration of the supernatant.
Analysis of ER Stress and Protein Expression:
- Perform Western blotting on cell lysates.
- Probe for ER stress markers: BiP/GRP78, phosphorylated eIF2α (p-eIF2α), and CHOP.
- Probe for the intracellular levels of the target protein.
- Use densitometry to semi-quantify band intensities, normalized to the loading control.
Analysis of Secreted Protein:
- Use a specific ELISA to quantify the amount of target protein secreted into the conditioned medium.
- Normalize the secreted protein concentration to the total cellular protein or cell number.
Thermostability Assay (Trypsin Sensitivity):
- Use conditioned medium containing the secreted protein.
- Incubate aliquots with a constant, low concentration of trypsin at a defined temperature (e.g., 37°C) for different time periods (e.g., 0, 5, 10, 20 minutes).
- Stop the reaction with a protease inhibitor or SDS-PAGE loading buffer.
- Analyze the intact protein band intensity via SDS-PAGE and Western blotting. More stable protein will be degraded more slowly.
Chemical Chaperone Evaluation Protocol
Analytical Techniques for Aggregation Characterization
Robust analytical methods are non-negotiable for quantifying and characterizing protein aggregates across the size spectrum.
Table 2: Key Analytical Methods for Protein Aggregation
| Analytical Technique | Size Range Detected | Information Provided | Application in Formulation |
|---|---|---|---|
| Size Exclusion Chromatography (SEC) | ~1-50 nm (soluble aggregates) | Quantifies soluble monomer and aggregate content; gold standard for stability indicating assay [31] | Stability monitoring, product release |
| Dynamic Light Scattering (DLS) | ~1 nm - 6 µm | Hydrodynamic radius, polydispersity; rapid assessment of size distribution [31] | High-throughput screening, early development |
| Micro-Flow Imaging (MFI) | ~1-100 µm (subvisible particles) | Particle count, size distribution, and morphology [31] | Critical for characterizing injectables, USP <788> |
| Turbidity (Absorbance at 350/600 nm) | >~1 µm (insoluble aggregates) | Quick, simple measure of large aggregate/precipitate formation [31] | Rapid screening during formulation |
| Circular Dichroism (CD) Spectroscopy | N/A (secondary/tertiary structure) | Conformational stability of protein backbone and aromatic side chains [33] | Mechanistic understanding of stabilization |
| Differential Scanning Calorimetry (DSC) | N/A | Thermal unfolding midpoint (Tm); quantifies conformational stability [31] | Excipient mechanism studies |
The Scientist's Toolkit: Essential Research Reagents and Materials
Table 3: Research Reagent Solutions for Aggregation Studies
| Reagent/Material | Function/Application | Key Considerations |
|---|---|---|
| Polysorbate 20 & 80 | Surfactant to prevent surface-induced aggregation at air-liquid and solid-liquid interfaces [29] | Quality and purity are critical; can undergo degradation (hydrolysis, oxidation). |
| Sucrose & Trehalose | Stabilizing sugars acting via preferential exclusion mechanism; bulking agents in lyophilization [30] [29] | Effective at high concentrations; can influence viscosity. |
| 4-Phenylbutyric Acid (4-PBA) | Chemical chaperone to ameliorate ER stress and promote correct protein folding in cellular systems [32] | Cytotoxicity at high doses; efficacy is mutation- and context-dependent. |
| D-Sorbitol & Betaine | Osmolytes/"chemical chaperones" that stabilize native protein structure and reduce inclusion body formation [30] | Often used in combination in cell culture media for recombinant protein production. |
| Size Exclusion Columns (e.g., TSKgel, Superdex) | High-resolution separation of monomer from soluble aggregates (dimers, oligomers) [31] | Method development is key; ensure mobile phase is compatible with formulation. |
| Low-Binding Microplates & Tubes | Minimize adsorptive losses of protein, especially at low concentrations, during screening [29] | Made from polypropylene or specialized surface-treated polymers. |
| Recombinant Molecular Chaperones (e.g., GroEL/ES) | In vitro refolding studies of proteins from inclusion bodies [30] [33] | Used in defined systems to understand and facilitate folding pathways. |
Successfully combating protein aggregation requires a systematic, multi-pronged approach. For researchers and drug development professionals, the following integrated strategy is recommended:
- Initiate Early: Integrate developability assessments, including computational analysis of aggregation-prone regions, during candidate selection [29].
- Embrace High-Throughput: Utilize DOE-driven, high-throughput screening to efficiently navigate the vast excipient and condition landscape [29].
- Leverage Advanced Analytics: Employ a suite of orthogonal analytical techniques (SEC, DLS, MFI) to fully characterize the aggregation profile.
- Consider the Therapeutic Modality: Tailor strategies to the specific molecule. Challenges for standard mAbs differ from those for bispecifics, ADCs, mRNA, or viral vectors [29].
- Explore Novel Mechanisms: Investigate emerging targets like epichaperomes—stable, disease-specific chaperone assemblies that rewire protein interaction networks and represent a new frontier for therapeutic intervention in complex diseases [34].
By systematically applying the formulation optimization protocols, leveraging chemical chaperones where appropriate, and employing rigorous analytical characterization, researchers can significantly de-risk development, enhance the stability of protein-based therapeutics, and accelerate the path to clinical success.
Protein-based therapeutics have revolutionized modern medicine, emerging as rivaling or superior alternatives to traditional small-molecule drugs [1]. However, the inherent susceptibility of proteins to denaturation, degradation, aggregation, immunogenicity, and rapid clearance presents significant challenges to their development and clinical application [1] [35]. To overcome these limitations, sophisticated chemical and genetic engineering strategies have been developed to enhance the therapeutic properties of protein drugs. Among the most effective approaches are PEGylation, site-specific mutagenesis, and glycosylation engineering, which can profoundly improve protein stability, pharmacokinetics, and pharmacodynamics while reducing undesirable immune responses [1] [36] [35]. This application note provides detailed protocols and strategic frameworks for implementing these transformative technologies in therapeutic protein development, framed within the context of optimizing protein-based therapeutics for clinical use.
PEGylation
Principle and Applications
PEGylation involves the covalent attachment of polyethylene glycol (PEG) chains to protein structures, a process that has become one of the most successful strategies for enhancing the therapeutic properties of protein drugs [36] [37]. This technology improves protein stability and pharmacokinetics through multiple mechanisms: increasing hydrodynamic size to reduce renal filtration, shielding proteolytic sites, decreasing immunogenicity, and enhancing solubility [36] [37] [38]. The large hydrodynamic volume of PEG creates a hydrated shield around the protein, sterically hindering interactions with proteases, antibodies, and clearance receptors [38]. For perspective, a 20-kDa PEG chain has a gyration radius of approximately 70-98 Å, creating a protective sphere much larger than that of a typical medium-sized protein like myoglobin (hydrodynamic radius ~20 Å) [38].
Quantitative Impact of PEGylation
Table 1: Clinically Approved PEGylated Therapeutics and Their Properties
| Drug Name | Therapeutic Protein | Protein Size (kDa) | PEG Size (kDa) | Site of Attachment | Year Approved | Primary Indication |
|---|---|---|---|---|---|---|
| Adagen | Adenosine deaminase | 40 | 5 | Lysines (non-specific) | 1990 | Severe combined immunodeficiency |
| Oncaspar | Asparaginase | 31 | 5 | Lysines (non-specific) | 1994 | Leukemia |
| PegIntron | Interferon-α-2b | 19.2 | 12 | Lysines (non-specific) | 2000 | Hepatitis C |
| Neulasta | Granulocyte colony-stimulating factor | 18.8 | 20 | N-Terminal amine | 2002 | Neutropenia |
| Cimzia | Anti-TNFα Fab' | 51 | 40 | C-Terminal cysteine | 2008 | Rheumatoid arthritis, Crohn's disease |
Experimental Protocol: Site-Specific PEGylation
Objective: Conjugate a 20 kDa monomethoxy PEG (mPEG) polymer to the N-terminus of Granulocyte Colony-Stimulating Factor (G-CSF) via reductive amination.
Principle: The protocol exploits the differential pKa between the α-amino group at the N-terminus (pKa ~7.8) and ε-amino groups of lysine residues (pKa ~10.1). At slightly acidic pH (6.0-6.5), the N-terminal amine is predominantly unprotonated and nucleophilic, while lysine amines remain protonated, enabling site-selective conjugation [36].
Materials:
- Recombinant G-CSF (18.8 kDa)
- mPEG-aldehyde (20 kDa)
- Sodium cyanoborohydride (NaBH₃CN)
- Sodium phosphate buffer (20 mM, pH 6.0)
- Size-exclusion chromatography (SEC) columns (e.g., Sephadex G-25)
- Dialysis membrane (10 kDa MWCO)
- RP-HPLC or MALDI-TOF MS for characterization
Procedure:
- Protein Preparation: Dialyze G-CSF (5 mg/mL) against 20 mM sodium phosphate buffer, pH 6.0, at 4°C overnight.
- Reaction Setup: Add 3-fold molar excess of mPEG-aldehyde to the protein solution while gently stirring at 4°C.
- Reductive Amination: Add sodium cyanoborohydride to a final concentration of 20 mM to initiate the reductive amination.
- Incubation: React for 2 hours at 4°C with continuous gentle mixing.
- Quenching: Terminate the reaction by adding glycine to a final concentration of 100 mM.
- Purification: Purify the PEGylated product using size-exclusion chromatography with 20 mM sodium phosphate, 150 mM NaCl, pH 7.4, as the eluent.
- Characterization: Analyze the monoPEGylated product by RP-HPLC and confirm molecular weight by MALDI-TOF MS. Determine biological activity using a cell proliferation assay.
Critical Parameters:
- Maintain pH at 6.0-6.5 to favor N-terminal selectivity
- Use mild reducing conditions (NaBH₃CN) to minimize protein aggregation
- Control temperature at 4°C to maintain protein stability during conjugation
- Optimize PEG:protein ratio (typically 3:1 to 5:1) to maximize monoPEGylated product
Research Reagent Solutions
Table 2: Essential Reagents for Protein PEGylation
| Reagent | Function | Application Notes |
|---|---|---|
| mPEG-succinimidyl carbonate (mPEG-SC) | Amine-reactive conjugation | Reacts with lysine ε-amines and N-terminus; requires pH 7.5-8.5 |
| mPEG-maleimide | Thiol-reactive conjugation | Site-specific coupling to cysteine residues; requires free thiol groups |
| mPEG-aldehyde | N-terminal specific conjugation | Selective for N-terminus at pH 6.0-6.5 via reductive amination |
| Branched PEG derivatives | Increased steric shielding | Enhanced pharmacokinetic benefits compared to linear PEGs |
| Sodium cyanoborohydride | Selective reducing agent | Reduces Schiff base intermediate without reducing disulfide bonds |
Figure 1: PEGylation Mechanisms and Benefits
Site-Specific Mutagenesis
Principle and Applications
Site-specific mutagenesis enables precise engineering of protein therapeutics through targeted amino acid substitutions, deletions, or insertions [1] [39]. This approach can enhance multiple therapeutic properties including stability, pharmacokinetics, and activity. A classic example is the development of insulin analogs with tuned pharmacokinetics: insulin glargine (Lantus) incorporates modifications that shift its isoelectric point toward physiological pH, resulting in precipitation upon injection and prolonged duration of action up to 24 hours [1]. Similarly, strategic mutations in antibody Fc regions can modulate half-life by tuning binding affinity to the neonatal Fc receptor (FcRn), which controls antibody recycling and persistence in circulation [1].
Quantitative Impact of Mutagenesis
Table 3: Representative Therapeutic Proteins Enhanced by Site-Specific Mutagenesis
| Protein Therapeutic | Amino Acid Modification | Effect on Properties | Therapeutic Benefit |
|---|---|---|---|
| Insulin glargine | Asn21→Gly (A chain), Arg-Arg addition (B chain) | Increased pI (≈7.0), precipitation at physiological pH | Long-acting profile (up to 24 hours) |
| Insulin glulisine | Asn3→Lys, Lys29→Glu (B chain) | Decreased pI (5.1), reduced hexamer formation | Rapid-acting profile |
| Ravulizumab (Ultomiris) | M428L/N434S (Fc region) | Enhanced FcRn binding at pH 6.0, reduced at pH 7.4 | Extended half-life (every 8 weeks dosing) |
| Aldesleukin (Proleukin) | Cysteine→Serine substitutions | Prevented oxidation and incorrect disulfide formation | Improved storage stability |
| Betaseron | Cysteine→Serine substitution | Enhanced stability against aggregation | Improved formulation stability |
Experimental Protocol: QuickChange-Style Site-Directed Mutagenesis
Objective: Introduce a specific point mutation into a plasmid encoding a therapeutic protein using an enhanced one-step PCR-based method.
Principle: This method utilizes complementary primer pairs containing the desired mutation to amplify the entire plasmid template. The primers are designed with extended non-overlapping sequences at the 3' end and complementary sequences at the 5' end, which enhances amplification efficiency by allowing PCR products to serve as templates in subsequent cycles [40]. Following amplification, the methylated parental DNA template is selectively digested, and the nicked mutated plasmid is transformed into E. coli for repair and propagation.
Materials:
- Target plasmid DNA (10-50 ng)
- High-fidelity DNA polymerase (e.g., PfuUltra)
- Custom mutagenesis primers (25-45 nucleotides, 40-60% GC content)
- DpnI restriction enzyme
- Competent E. coli cells (e.g., XL1-Blue)
- LB agar plates with appropriate antibiotic
- DNA sequencing reagents for verification
Procedure:
- Primer Design: Design forward and reverse primers that are fully complementary, each typically 25-45 bases long, with the mutation located in the middle. Include non-overlapping sequences at the 3' end and complementary sequences at the 5' end. Ensure the melting temperature of non-overlapping sequences (Tmno) is 5-10°C higher than primer-primer complementary sequences (Tmpp) [40].
- PCR Setup: Prepare 50 μL reaction containing:
- 10-50 ng plasmid DNA template
- 125 ng of each primer
- 1× reaction buffer
- 0.2 mM dNTPs
- 1-2 units high-fidelity DNA polymerase
- Thermocycling Parameters:
- Initial denaturation: 95°C for 2 minutes
- 18 cycles:
- Denaturation: 95°C for 30 seconds
- Annealing: 55-65°C (primer-specific Tm) for 1 minute
- Extension: 68°C for 1 minute/kb of plasmid length
- Final extension: 68°C for 10 minutes
- Parental Template Digestion: Add 1 μL of DpnI restriction enzyme directly to the PCR reaction and incubate at 37°C for 1-2 hours to digest methylated parental DNA.
- Transformation: Transform 1-5 μL of the DpnI-treated DNA into 50 μL of competent E. coli cells using standard heat-shock method.
- Screening: Plate cells on LB agar containing appropriate antibiotic and incubate overnight at 37°C.
- Verification: Pick 2-4 colonies for plasmid DNA preparation and verify the mutation by DNA sequencing.
Critical Parameters:
- Primer design is crucial: ensure minimal secondary structure and primer-dimer formation
- Use high-fidelity polymerase to minimize introduction of random mutations
- Optimize number of PCR cycles to balance yield and mutation rate (typically 16-18 cycles)
- Include a negative control (no polymerase) to assess template carryover
- Always sequence the entire gene to confirm desired mutation and absence of unintended mutations
Research Reagent Solutions
Table 4: Essential Reagents for Site-Directed Mutagenesis
| Reagent | Function | Application Notes |
|---|---|---|
| High-fidelity DNA polymerase | PCR amplification | Reduces random mutations; PfuUltra recommended |
| DpnI restriction enzyme | Parental template digestion | Specifically cleaves methylated dam+ DNA |
| XL1-Blue competent cells | Plasmid propagation | High transformation efficiency for plasmid DNA |
| Synthetic oligonucleotide primers | Mutation introduction | HPLC-purified; designed with mutation in center |
| Plasmid miniprep kit | DNA isolation | Rapid isolation of plasmid DNA for sequencing |
Figure 2: Site-Directed Mutagenesis Workflow
Glycosylation Engineering
Principle and Applications
Glycosylation, the enzymatic attachment of carbohydrate structures to proteins, represents one of the most critical post-translational modifications for therapeutic proteins [35] [41]. Approximately 50% of human proteins are glycosylated, with this modification playing essential roles in folding, intracellular trafficking, stability, circulatory half-life, and immunogenicity [41]. For therapeutic proteins, glycoengineering strategies can dramatically enhance efficacy by modulating pharmacokinetic profiles, improving molecular stability, and fine-tuning biological activity [35] [41]. Erythropoietin (EPO) stands as a pioneering example where glycoengineering significantly improved pharmacokinetics - the addition of two extra N-glycosylation sites increased molecular size and sialic acid content, resulting in extended serum half-life and reduced receptor-mediated clearance [41].
Quantitative Impact of Glycosylation
Table 5: Impact of Glycosylation on Therapeutic Protein Properties
| Glycoengineering Approach | Effect on Physicochemical Properties | Effect on Pharmacokinetics | Therapeutic Example |
|---|---|---|---|
| Addition of N-glycosylation sites | Increased molecular weight, enhanced conformational stability | Reduced renal clearance, extended half-life | Darbepoetin alfa (2 additional N-glycans) |
| Sialylation enhancement | Increased negative charge, improved solubility | Reduced clearance via asialoglycoprotein receptor | EPO variants with increased sialic acid |
| Afucosylation | Altered Fc domain conformation | Enhanced ADCC activity | Obinutuzumab, Benralizumab |
| Mannose trimming | Altered glycan structure | Targeted delivery to antigen-presenting cells | Glucocerebrosidase (imiglucerase) |
| Galactosylation modulation | Altered glycan branching | Modified serum half-life | Various monoclonal antibodies |
Experimental Protocol: Glycoengineering of Therapeutic Proteins
Objective: Modulate N-glycosylation patterns of a therapeutic protein through mammalian cell culture engineering.
Principle: This protocol utilizes genetic engineering to modulate glycosylation enzymes in CHO cells and culture condition optimization to control glycosylation microheterogeneity. By targeting specific steps in the N-glycosylation pathway (Figure 3), defined glycoforms with enhanced therapeutic properties can be produced [41].
Materials:
- CHO-S or HEK293 cell lines
- Expression vector encoding target protein
- CRISPR/Cas9 system for gene editing
- Kifunensine (α-mannosidase I inhibitor)
- Swainsonine (Golgi α-mannosidase II inhibitor)
- N-Acetylmannosamine (sialic acid precursor)
- Lectin chromatography columns (e.g., ConA, SNA)
- HILIC-UPLC or MS-based glycan analysis
- Protein A affinity chromatography
Procedure:
- Host Cell Engineering:
- Design gRNAs targeting specific glycosyltransferases (e.g., FUT8 for afucosylation, MGAT1 for hybrid/complex glycan formation)
- Transfect CHO cells with CRISPR/Cas9 and gRNA constructs
- Select clones using appropriate antibiotics (e.g., puromycin)
- Screen clones by flow cytometry using lectin staining or PCR for identification of knockout clones
Recombinant Protein Expression:
- Transfect engineered CHO cells with expression vector encoding target protein
- Select stable pools using appropriate selection markers (e.g., glutamine synthetase system)
- Expand high-producing clones in serum-free medium
Glycosylation Pathway Modulation:
- Add glycosidase inhibitors (kifunensine at 10-50 μM or swainsonine at 1-10 μM) to culture medium 24 hours post-seeding
- Supplement with N-acetylmannosamine (1-10 mM) to enhance sialylation
- Optimize culture parameters (pH, dissolved oxygen, feeding strategies) to control glycosylation consistency
Protein Purification:
- Harvest culture supernatant by centrifugation
- Purify target protein using Protein A affinity chromatography (for Fc-containing proteins) or other appropriate method
- Dialyze against appropriate formulation buffer
Glycan Analysis:
- Release N-glycans using PNGase F
- Label released glycans with 2-AB fluorescent dye
- Analyze by HILIC-UPLC with fluorescence detection
- Confirm structures by LC-MS/MS
Critical Parameters:
- Monitor cell viability and productivity throughout culture period
- Characterize glycan heterogeneity using multiple analytical methods
- Ensure genetic stability of engineered cell lines through multiple passages
- Control culture conditions (pH, temperature, metabolites) to minimize batch-to-batch variation
- Correlate specific glycoforms with therapeutic efficacy (PK/PD) and immunogenicity
Research Reagent Solutions
Table 6: Essential Reagents for Glycoengineering
| Reagent | Function | Application Notes |
|---|---|---|
| Kifunensine | α-Mannosidase I inhibitor | Produces high-mannose glycoforms (Man8-9) |
| Swainsonine | Golgi α-mannosidase II inhibitor | Produces hybrid-type N-glycans |
| N-Acetylmannosamine | Sialic acid precursor | Enhances terminal sialylation |
| CRISPR/Cas9 system | Gene editing | Knockout of specific glycosyltransferases |
| Lectin chromatography | Glycoform separation | ConA for mannose, SNA for sialic acid |
| PNGase F | N-glycan release | Enzymatic cleavage of N-linked glycans |
| HILIC-UPLC columns | Glycan separation | Hydrophilic interaction chromatography |
Figure 3: N-linked Glycosylation Pathway in Mammalian Cells
PEGylation, site-specific mutagenesis, and glycosylation represent three powerful strategies for optimizing the therapeutic potential of protein-based drugs. Each approach offers distinct advantages: PEGylation dramatically improves pharmacokinetics through size enlargement and steric shielding; site-specific mutagenesis enables precise tuning of stability and activity; and glycosylation engineering provides multifaceted control over pharmacokinetics, pharmacodynamics, and immunogenicity. The selection of appropriate modification strategy depends on the specific therapeutic goals, protein characteristics, and manufacturing considerations. As protein therapeutics continue to expand their dominance in treating diverse diseases, these stabilization technologies will play increasingly critical roles in developing next-generation biologics with enhanced efficacy, safety, and patient compliance. Future directions will likely focus on combination approaches that integrate multiple modification strategies to create optimized therapeutic proteins with customized properties for specific clinical applications.
The development of protein-based therapeutics represents a cornerstone of modern biopharmaceutical research, enabling the treatment of complex diseases ranging from cancer to rare genetic disorders. A critical challenge facing this class of biologics is their often abbreviated serum half-life, which necessitates frequent dosing, increases treatment burden, and may compromise therapeutic efficacy. This Application Note addresses two principal engineering strategies for optimizing the pharmacokinetic (PK) profiles of therapeutic proteins: Fc neonatal receptor (FcRn) engineering and fusion protein technologies.
The FcRn is a master regulator of IgG homeostasis, mediating pH-dependent antibody recycling and transcytosis that confers extended serum persistence [42] [43]. Simultaneously, fusion proteins strategically combine functional domains to harness natural carrier systems such as albumin or Fc fragments, thereby evading rapid clearance pathways [44]. This document provides a structured technical resource featuring quantitative comparisons, detailed experimental protocols, and mechanistic visualizations to support researchers in implementing these half-life extension strategies within their therapeutic development pipelines.
FcRn Engineering: Principles and Applications
Mechanism of FcRn-Mediated Half-Life Extension
The FcRn safeguards IgG antibodies from lysosomal degradation via a finely tuned pH-dependent binding cycle. Following pinocytic uptake into endothelial cells, IgG binds FcRn within acidic endosomes (pH ~6.0). This engagement diverts the IgG-FcRn complex from degradation pathways, directing it instead to the cell surface where exposure to neutral pH (7.4) triggers IgG release back into circulation [42] [43]. Engineering the Fc domain to enhance this natural process requires precisely modulated binding kinetics—strengthened affinity at acidic pH to outcompete endogenous IgG for FcRn binding, coupled with rapid dissociation at neutral pH to ensure efficient release into the bloodstream [42].
Table 1: Clinically Validated FcRn-Binding Fc Variants
| Variant Name | Amino Acid Mutations | Mechanistic Approach | Reported Half-Life Extension (vs. wild-type) | Example Therapeutics |
|---|---|---|---|---|
| YTE | M252Y/S254T/T256E | Enhances FcRn affinity at pH 6.0 | 2- to 5-fold in humans [43] | Beyfortus, Evusheld [42] |
| LS | M428L/N434S | Enhances FcRn affinity at pH 6.0 (Xtend) | 4-fold in humans (e.g., Ravulizumab) [43] | Ultomiris, sotrovimab [42] |
| DHS | L309D/Q311H/N434S | Balanced kinetics: moderate acidic pH affinity + rapid neutral pH dissociation | Significantly prolonged in hFcRn mice [42] | Preclinical/Development |
| YML | L309Y/Q311M/M428L | Superior FcRn association at pH 6.0 + accelerated dissociation at pH 7.4 | 6.1-fold in hFcRn transgenic mice [42] | Preclinical/Development |
Experimental Protocol: In Vitro FcRn Binding Affinity Kinetics
Objective: Quantify the pH-dependent binding kinetics of Fc-engineered antibodies to human FcRn (hFcRn) using Surface Plasmon Resonance (SPR).
Materials:
- Biacore or equivalent SPR instrument (e.g., Cytiva CM5 sensor chip) [42]
- Running Buffer pH 5.8: 50 mM sodium phosphate, 150 mM NaCl
- Running Buffer pH 7.4: 50 mM sodium phosphate, 150 mM NaCl
- Regeneration Buffer: 50 mM sodium phosphate, 150 mM NaCl, pH 7.4
- Purified hFcRn protein
- Test Articles: Wild-type and Fc-variant antibodies
Procedure:
- Sensor Chip Preparation: Immobilize an anti-human Fc capture antibody on a CM5 series S chip to facilitate the oriented capture of test antibodies.
- Ligand Capture: Dilute test antibodies to 1 µg/mL in HBS-EP buffer (pH 7.4). Inject over the capture surface for 60 seconds to achieve a consistent capture level (~100 Response Units).
- Analyte Binding: Inject a concentration series of hFcRn (e.g., 0–1000 nM) over the captured antibody surface at pH 5.8, using a contact time of 120 seconds and a dissociation time of 600 seconds.
- Regeneration: Remove the captured antibody and regenerate the capture surface with a single 30-second injection of regeneration buffer (pH 7.4) between cycles.
- Neutral pH Assessment: Repeat steps 2-4 using running buffer at pH 7.4 to confirm minimal binding at physiological pH.
- Data Analysis: Process double-referenced sensorgrams and fit the data to a 1:1 binding model to determine the association rate (ka), dissociation rate (kd), and equilibrium dissociation constant (KD) at both pH conditions.
Key Consideration: An ideal FcRn-engineering outcome is a significantly lower KD at pH 5.8 coupled with a very high KD (indicating rapid dissociation) at pH 7.4 [42].
Figure 1: SPR Workflow for FcRn Binding Kinetics. The diagram outlines the key steps for characterizing pH-dependent antibody-FcRn interactions.
Fusion Protein Strategies for Half-Life Extension
Leveraging Albumin and Fc Domains as Carriers
Fusion proteins extend half-life by genetically linking the therapeutic protein to a long-circulating carrier molecule. The two dominant approaches are Fc fusion and albumin fusion (or albumin-binding), both of which exploit FcRn recycling pathways [44].
Fc Fusion Proteins directly fuse the therapeutic domain to the Fc region of IgG1, conferring the natural long half-life of an antibody. Over six Fc-fusion proteins are FDA-approved, with combined sales indicating significant clinical impact [44].
Albumin Fusion and Albumin-Binding Strategies leverage albumin's exceptional serum half-life (~19 days). This can be achieved by creating genetic fusions to albumin itself or by incorporating albumin-binding domains, such as nanobodies or single-chain variable fragments (scFvs) that target albumin [45] [46]. A key advantage in oncology is albumin's natural accumulation in tumors due to the Enhanced Permeability and Retention (EPR) effect [45].
Table 2: Comparison of Half-Life Extension Fusion Strategies
| Strategy | Mechanism of Action | Key Advantages | Reported Half-Life Extension | Example Candidates |
|---|---|---|---|---|
| Fc Fusion | Utilizes FcRn recycling pathway of IgG | Proven platform, potential for effector functions | Matches IgG half-life (e.g., ~21 days) | Eylea, Nplate [44] |
| Albumin Fusion | Utilizes FcRn recycling pathway of albumin | Very long native half-life, tumor targeting via EPR | Half-life of albumin (~19 days) | Albiglutide [44] |
| Albumin-Binding Domain | Binds endogenous albumin; FcRn recycling | Non-covalent, modular design | 10-fold in mice (sdADC) [45] | n501-αHSA-MMAE [45], Ozoralizumab [45] |
| Anti-HSA scFv | Binds Domain II of endogenous albumin | Small size, improved tumor penetration | Fused cytokine: 2.6h to 75.8h in mice [46] | Preclinical scFv 49A04 [46] |
Experimental Protocol: Pharmacokinetic Profiling in Murine Models
Objective: Evaluate the in vivo serum half-life of an albumin-binding fusion protein in a murine model.
Materials:
- Test Articles: The fusion protein (e.g., n501–αHSA–MMAE) and a non-albumin-binding control (e.g., n501–MMAE) [45]
- Animal Model: Wild-type mice or relevant tumor-bearing xenograft models (e.g., BxPC-3 pancreatic cancer model) [45]
- Dosing Solution: Protein diluted in sterile PBS
- Equipment: Microcentrifuge, ELISA plates, plate reader, or LC-MS/MS instrumentation
Procedure:
- Dosing and Sample Collection:
- Divide mice into experimental groups (n=5-7).
- Administer a single intravenous (IV) or subcutaneous (SC) bolus of the test article.
- Collect blood samples (e.g., via retro-orbital bleeding or tail vein) at predetermined time points (e.g., 5 min, 1h, 6h, 24h, 48h, 72h, 96h, 168h post-dose).
- Centrifuge blood samples to isolate serum and store at -80°C until analysis.
Bioanalytical Quantification (ELISA):
- Coating: Coat ELISA plates with an anti-idiotype antibody or target antigen (e.g., 5T4 for n501) to capture the fusion protein.
- Blocking: Block plates with a protein-based buffer (e.g., 3% BSA in PBS).
- Sample Incubation: Add serially diluted serum samples and standards to the plate.
- Detection: Incubate with a biotinylated detection antibody (e.g., anti-human Fab or anti-HSA), followed by streptavidin-HRP.
- Signal Development: Add TMB substrate, stop the reaction with acid, and measure absorbance.
- Data Reduction: Calculate serum concentration at each time point using the standard curve.
Pharmacokinetic Analysis:
- Plot mean serum concentration versus time for each group.
- Use non-compartmental analysis (NCA) with software like Phoenix WinNonlin to calculate PK parameters:
- Terminal Half-Life (t₁/₂): Time for serum concentration to reduce by half.
- Area Under the Curve (AUC): Total drug exposure over time.
- Clearance (CL): Volume of serum cleared of drug per unit time.
- Mean Residence Time (MRT): Average time drug molecules reside in the body.
Key Consideration: The positive control (e.g., n501–MMAE) should show rapid clearance, while the albumin-binding variant (e.g., n501–αHSA–MMAE) should demonstrate significantly extended exposure, evidenced by a larger AUC and longer t₁/₂ [45].
Figure 2: Albumin-Binding Fusion Protein Mechanism. The therapeutic fusion protein binds endogenous albumin, forming a complex that is protected from clearance via FcRn-mediated recycling, leading to prolonged half-life and improved tumor targeting.
The Scientist's Toolkit: Essential Research Reagents
Successful implementation of half-life extension strategies requires a suite of specialized reagents and tools.
Table 3: Key Research Reagent Solutions for Half-Life Extension Studies
| Research Tool | Function/Application | Example Vendors / Sources |
|---|---|---|
| Recombinant hFcRn Protein | In vitro binding kinetics studies (SPR, BLI) | ACROBiosystems; commercial bioreagents [43] |
| FcRn Affinity Column (Gen2) | Chromatographic assessment of pH-dependent binding | Roche Diagnostics [42] |
| Human FcRn Transgenic Mice | In vivo PK model with human FcRn biology | Available from several commercial breeders |
| Anti-HSA Nanobodies / scFvs | Albumin-binding modules for fusion constructs | In-house phage display or commercial suppliers [45] [46] |
| Biolayer Interferometry (BLI) | Label-free kinetic analysis of protein interactions | Sartorius Octet systems [42] [45] |
| SPR Sensor Chips (CM5) | Immobilization for kinetic binding studies | Cytiva [42] |
| DSC Instrumentation | Assessing thermal stability of Fc mutants | Malvern Panalytical, TA Instruments [43] |
Within the development of protein-based therapeutics, the precise delivery of a biologic to a tumor site is paramount for achieving high efficacy and minimizing off-target effects [47]. Two fundamental paradigms, passive and active tumor targeting, govern the strategic approach to this challenge. These mechanisms leverage distinct pathophysiological and biological principles to concentrate therapeutic agents within malignant tissues [48]. This document provides a detailed overview of these targeting strategies, framed within the context of protein engineering, and includes structured protocols for their experimental evaluation. The content is designed to support researchers and drug development professionals in the rational design and testing of next-generation protein biologics.
Core Targeting Mechanisms and Quantitative Parameters
Passive Targeting: The Enhanced Permeation and Retention (EPR) Effect
Passive targeting primarily exploits the unique anatomical and pathophysiological characteristics of solid tumors, collectively known as the Enhanced Permeation and Retention (EPR) effect [48] [49]. This phenomenon was first described by Matsumura and Maeda in 1986 and remains a cornerstone of cancer nanomedicine and macromolecular therapeutic design [49].
The EPR effect arises from two key abnormalities in tumor tissue:
- Hypervasculature: Tumor blood vessels are rapidly formed through angiogenesis, leading to defective architecture with large fenestrations (gaps) between endothelial cells [48] [49].
- Impaired Lymphatic Drainage: Tumors frequently lack a fully functional lymphatic system, which reduces the clearance of accumulated macromolecules and particles from the tumor interstitium [49].
The combination of these factors allows macromolecules and nanocarriers to extravasate from the bloodstream into the tumor tissue more easily than in healthy tissues and then be retained there for extended periods [47]. The efficacy of passive targeting is highly dependent on the physicochemical properties of the therapeutic agent, with size being a critical parameter.
Table 1: Physicochemical Parameters for Optimal Passive Targeting via the EPR Effect
| Parameter | Optimal Range | Rationale | Key References |
|---|---|---|---|
| Hydrodynamic Size | 10 - 100 nm | Particles <10 nm are rapidly cleared by renal filtration; particles >100 nm are susceptible to phagocytic clearance by the reticuloendothelial system (RES) [49]. | [48] [49] |
| Molecular Weight | > 40 kDa | Macromolecules larger than ~40 kDa exhibit prolonged circulation and are effectively retained in tumors due to the EPR effect [49]. | [47] [49] |
| Tumor Vasculature Pore Size | 100 - 800 nm | The gap junctions between endothelial cells in tumor vasculature are highly irregular and variable, allowing the extravasation of nano-sized drugs [48] [49]. | [48] [49] |
Active Targeting: Ligand-Receptor Interactions
Active targeting enhances the specificity of therapeutic delivery by decorating the surface of protein biologics or their carriers with targeting ligands that recognize and bind to specific molecules (receptors, antigens) overexpressed on the surface of cancer cells or within the tumor microenvironment (TME) [47] [48]. This strategy aims to increase cellular uptake of the therapeutic via receptor-mediated endocytosis and can improve tumor selectivity beyond what is achievable by the EPR effect alone [49].
A wide variety of targeting moieties can be employed, including monoclonal antibodies, antibody fragments, peptides, aptamers, and small molecules [48]. The choice of ligand depends on the target receptor's expression profile, binding affinity, and the intended therapeutic strategy.
Table 2: Common Targeting Ligands and Their Molecular Targets
| Targeting Ligand | Molecular Target | Therapeutic Context | Key References |
|---|---|---|---|
| Monoclonal Antibodies (e.g., Trastuzumab) | HER2 receptor | HER2-positive breast cancer [27]. | [47] [27] |
| Affibodies / DARPins | Various tumor-associated antigens (e.g., VEGF, HGF) | Solid tumors and hematological malignancies; used in engineered alternative protein scaffolds [47]. | [47] |
| Peptides (e.g., RGD peptide) | Integrins (e.g., αvβ3) | Angiogenesis and metastatic tumors [48]. | [48] |
| Folate | Folate receptor | Overexpressed in various cancers (e.g., ovarian, lung) [48]. | [48] |
| Engineered Natural Ligands (e.g., TRAIL) | Death Receptors (DR4/DR5) | Selectively induces apoptosis in cancer cells [50]. | [50] |
Diagram 1: Passive vs. Active Targeting Mechanisms. Passive targeting relies on the leaky vasculature and poor lymphatic drainage of tumors (EPR effect), while active targeting uses specific ligand-receptor interactions for cellular uptake.
Experimental Protocols for Evaluating Targeting Efficacy
Protocol 1: In Vitro Binding and Internalization Assay
This protocol assesses the specificity and efficiency of an actively targeted protein therapeutic binding to and being internalized by target cells.
1. Materials
- Target Cells: Cell line expressing the receptor of interest and a negative control line.
- Test Articles: Fluorescently labeled targeted therapeutic, non-targeted counterpart, and free fluorescent ligand.
- Equipment: Confocal microscope, flow cytometer, cell culture incubator.
- Buffers: Flow cytometry buffer, fixation buffer.
2. Methodology 1. Cell Seeding: Seed target and control cells in multi-well plates or on glass-bottom dishes 24 hours prior to the assay to achieve 70-80% confluency. 2. Treatment: Incubate cells with the fluorescently labeled test articles at a predetermined concentration (e.g., 1-100 nM) in serum-free media for 1-4 hours at either 4°C (to measure binding only, as internalization is inhibited) or 37°C (to measure both binding and internalization). 3. Washing: After incubation, wash cells thoroughly with ice-cold PBS to remove unbound therapeutics. 4. Analysis: - Flow Cytometry: Trypsinize and resuspend cells in flow cytometry buffer. Analyze the geometric mean fluorescence intensity (MFI) of at least 10,000 cells per sample. The shift in MFI in target cells at 4°C indicates specific binding. The increase in MFI at 37°C compared to 4°C indicates internalization. - Confocal Microscopy: For cells on glass-bottom dishes, fix with paraformaldehyde, stain the cell membrane and nuclei with appropriate dyes, and mount. Acquire Z-stack images to visualize the intracellular localization of the therapeutic, confirming internalization beyond surface binding.
3. Data Interpretation
- High fluorescence in target cells at 4°C confirms specific receptor binding.
- A significant increase in fluorescence at 37°C in target cells, particularly with intracellular punctate staining on confocal images, confirms successful internalization.
- Minimal signal in control cells and with the non-targeted therapeutic demonstrates specificity.
Protocol 2: In Vivo Biodistribution and Tumor Accumulation Study
This protocol quantitatively evaluates the passive and active targeting capabilities of a protein therapeutic in a live tumor-bearing animal model.
1. Materials
- Animal Model: Immunocompromised mice (e.g., nude or NSG) subcutaneously implanted with target receptor-positive human tumor xenografts.
- Test Articles: Targeted and non-targeted protein therapeutics labeled with a near-infrared (NIR) dye (e.g., Cy5.5, IRDye800CW) or a radionuclide (e.g., ⁹⁹mTc, ¹²⁵I).
- Equipment: In vivo imaging system (IVIS) or single-photon emission computed tomography (SPECT) scanner, anesthesia setup.
- Software: Image analysis software (e.g., Living Image).
2. Methodology 1. Dosing: When tumors reach a volume of 200-500 mm³, randomly assign mice to groups (n=5-8) and administer the labeled test articles via intravenous injection. 2. Longitudinal Imaging: Anesthetize mice and image them at multiple time points post-injection (e.g., 1, 4, 24, 48, 72 hours) using IVIS or SPECT. 3. Ex Vivo Analysis: At the terminal time point (e.g., 72 hours), euthanize the animals. Collect tumors and major organs (liver, spleen, kidneys, heart, lung). Image the ex vivo organs to quantify signal distribution. 4. Quantification: Draw regions of interest (ROIs) around tumors and organs in the images. Calculate metrics such as Total Radiant Efficiency (for fluorescence) or % Injected Dose per Gram of tissue (%ID/g).
3. Data Interpretation
- Compare the tumor accumulation (%ID/g) of the targeted therapeutic versus the non-targeted one. A statistically significant higher accumulation indicates successful active targeting.
- Analyze the tumor-to-organ ratios (e.g., tumor-to-liver, tumor-to-muscle). High ratios indicate good specificity and reduced off-target accumulation.
- The non-targeted therapeutic's accumulation in the tumor is primarily attributable to the passive EPR effect.
The Scientist's Toolkit: Research Reagent Solutions
Table 3: Essential Reagents for Targeting Research
| Research Reagent | Function/Application | Example Use Case |
|---|---|---|
| PEGylation Reagents | Covalently attaches polyethylene glycol (PEG) to proteins, increasing hydrodynamic size and reducing immunogenicity to exploit the EPR effect [1]. | Half-life extension of recombinant TRAIL or antibody fragments [1] [50]. |
| Site-Specific Mutagenesis Kits | Introduces point mutations to enhance stability, alter FcRn binding for half-life extension, or reduce immunogenicity [1]. | Creating Fc variants (e.g., YTE, LS) to modulate antibody half-life [1]. |
| Targeting Ligand Libraries | Provides diverse sets of ligands (peptides, affibodies, DARPins) for screening against novel tumor targets [47] [27]. | Identifying high-affinity binders for an orphan receptor overexpressed in a specific cancer type. |
| Fluorescent & Radio Labels | Tags proteins for tracking and quantification in vitro and in vivo. | Labeling antibodies with Cy5.5 for IVIS imaging or ⁹⁹mTc for SPECT/CT biodistribution studies. |
| Directed Evolution Platforms | Uses iterative rounds of mutation and selection to engineer proteins with enhanced binding affinity or stability [27]. | Optimizing the affinity of a scFv antibody fragment for a cancer antigen. |
Diagram 2: Protein Therapeutic Engineering & Evaluation Workflow. A streamlined process from engineering a candidate protein for passive and/or active targeting through to in vitro and in vivo evaluation.
Passive and active targeting mechanisms offer complementary pathways for improving the delivery of protein-based therapeutics to tumors. The EPR effect provides a foundational mechanism for tumor accumulation, while active targeting, enabled by sophisticated protein engineering, enhances specificity and cellular uptake. The experimental protocols and tools outlined herein provide a framework for systematically evaluating and optimizing these strategies. The continued integration of these approaches, along with advancements in protein engineering such as the development of alternative scaffolds and bispecific formats, promises to yield increasingly potent and precise cancer biologics [47] [27].
From Bench to Bedside: Analytical Assessment, Clinical Validation, and Biosimilars
Comparative Analytical Studies for Demonstrating Biosimilarity
Within the rapidly advancing field of protein-based therapeutics engineering, the demonstration of biosimilarity stands as a critical scientific and regulatory requirement. Comparative analytical studies form the foundation of this assessment, providing the most sensitive tool for detecting differences between a proposed biosimilar and its reference biologic product [51] [52]. These studies are built upon the principle that the totality of evidence—encompassing extensive analytical, functional, and stability data—can substantiate a conclusion of biosimilarity, potentially reducing the need for extensive clinical trials [51] [52]. As regulatory agencies worldwide, including the FDA and EMA, emphasize a risk-based approach, the rigor and design of these analytical protocols directly influence the scope of subsequent nonclinical and clinical data required for approval [52]. This document outlines detailed application notes and protocols for conducting robust comparative analytical studies, framed within the context of modern protein engineering research.
Regulatory Framework and Key Principles
The regulatory pathway for biosimilars, established under the Biologics Price Competition and Innovation Act (BPCI Act) in the U.S., requires that a biosimilar be highly similar to the reference product notwithstanding minor differences in clinically inactive components, and that there are no clinically meaningful differences in terms of safety, purity, and potency [53] [54]. The FDA's Biosimilars Action Plan encourages the development of biosimilars as lower-cost alternatives, with comparative analytical studies serving as the cornerstone for demonstration of biosimilarity [53].
A fundamental requirement is the use of a stepwise approach for obtaining totality-of-the-evidence [54]. This approach begins with analytical similarity assessment, investigating structural and functional characteristics through Critical Quality Attributes (CQAs), and proceeds through pharmacokinetic/pharmacodynamic and finally clinical similarity assessment [54]. When using multiple reference products (e.g., US-licensed and EU-approved products), regulators typically require a 3-way pairwise comparative bridging study to justify the use of clinical data generated with a non-US-licensed comparator [54].
Table 1: Key Regulatory Requirements for Comparative Analytical Studies
| Regulatory Aspect | FDA Recommendation/Requirement | EMA Consideration |
|---|---|---|
| Reference Product Characterization | Thorough physicochemical & biological assessment required; 10+ lots across years to capture variability [52] | Similar requirement for extensive reference product characterization |
| Biosimilar Lot Selection | 6–10 lots, including clinical & commercial-scale batches [52] | Comparable lot-to-lot variability assessment required |
| Analytical Framework | Risk assessment to rank attributes by impact; Quantitative (Quality Ranges) and qualitative analyses [52] | Similar risk-based approach for attribute classification |
| Acceptance Criteria | Target of ≥90% of biosimilar lot values within reference Quality Range (typically mean ± 3SD) [52] | Similar statistical approaches for equivalence testing |
| Non-US Comparators | Require three-way bridging data [54] [52] | Permits Foreign Approved Comparators with appropriate justification |
Experimental Design and Statistical Approaches
Reference and Biosimilar Product Sampling
A scientifically sound sampling strategy is crucial for a representative analytical comparison. For the reference biologic product, FDA recommends testing ≥10 lots acquired across multiple years to adequately capture inherent product variability [52]. For the proposed biosimilar, analysis of 6–10 lots is recommended, which should include batches manufactured at both clinical and commercial scales to demonstrate process consistency and robustness [52].
Statistical Methods for Biosimilarity Assessment
For the common scenario involving multiple reference products, several statistical approaches have been developed:
Conventional 3-Way Pairwise Comparison: This method involves separate equivalence tests for: Biosimilar vs. US-licensed reference, Biosimilar vs. EU-approved reference, and US-licensed vs. EU-approved reference [54]. While straightforward, this approach has limitations including failure to fully utilize all collected data in each comparison, potential use of different equivalence margins, and inflation of Type I error due to multiple testing [54].
Simultaneous Confidence Interval (CI) Method: This innovative approach, based on fiducial inference, addresses deficiencies in the conventional method by using all collected data simultaneously [54]. It is particularly suitable for parallel group studies and has been shown to achieve statistical power similar to conventional approaches while providing more robust inference [54].
Multiplicity-Adjusted TOST (MATOST): For crossover study designs, this method applies p-value adjustment techniques (e.g., Holm and Bonferroni) to control Type I error in multiple comparisons [54]. However, simulation studies indicate this method may require larger sample sizes, making it less favorable in many development scenarios [54].
Analytical Methodologies and Characterization Protocols
Comprehensive Physicochemical Characterization
A tiered approach to physicochemical characterization should assess attributes from primary through quaternary structure, with the level of scrutiny aligned with the potential risk to safety and efficacy.
Table 2: Physicochemical Characterization Tests and Methods
| Attribute Category | Specific Tests | Standard Methods | Risk Level |
|---|---|---|---|
| Primary Structure | Amino acid sequence, Sequence variants, Terminal sequences | LC-MS/MS, Peptide mapping | High |
| Higher Order Structure | Secondary/tertiary structure, Disulfide bridges, Aggregation | CD, FTIR, NMR, AUC, SEC | High |
| Post-Translational Modifications | Glycosylation profile, Oxidation, Deamidation | LC-MS, HILIC, CE-LIF | High |
| Color and Clarity | Visual inspection, Tristimulus colorimetry | USP <631>, EP 2.2.2 | Low |
| General Properties | pH, Osmolality, Particulate matter | Compendial methods | Low |
Color Assessment Protocol: While seemingly simple, color determination represents a critical quality attribute. Methodologies are governed by both USP <631> and EP 2.2.2, which recommend comparing the test article against standardized color series [55]. The instrumental method described in USP <1061>, based on tristimulus colorimetry, is preferred over visual observation to reduce subjectivity and increase detection range for subtle changes [55]. The natural yellowish tint of protein solutions arises from aromatic residues (tryptophan and tyrosine) absorbing violet/blue light [55]. Color changes can indicate the presence of specific variants or impurities, such as tryptophan oxidation (yellow/brown), advanced glycation end products (brown), or adducts with media components like vitamin B12 (red/pink) [55].
Functional Characterization
Functional assays must evaluate mechanisms of action (MOA) relevant to the therapeutic protein's clinical activity. For monoclonal antibodies, this typically includes:
- Binding Assays: Surface plasmon resonance (SPR) or ELISA-based methods to determine binding affinity (KD) and kinetics (kon, koff) to target antigens and relevant Fc receptors.
- Cell-Based Assays: To measure neutralization potency, antibody-dependent cellular cytotoxicity (ADCC), complement-dependent cytotoxicity (CDC), and phagocytosis (ADCP).
- Enzymatic Activity Assays: For enzyme replacement therapies, determination of specific activity using relevant substrates under physiological conditions.
All functional assays should be validated per ICH guidelines and include appropriate reference standards with predetermined acceptance criteria based on reference product variability.
Biosimilarity Assessment Workflow
The following diagram illustrates the comprehensive workflow for conducting comparative analytical studies, from initial planning through final biosimilarity assessment:
Diagram: Biosimilarity Assessment Workflow. This workflow outlines the systematic process from initial product understanding through regulatory submission, highlighting key stages including risk assessment, analytical characterization, and statistical comparison.
The Scientist's Toolkit: Essential Research Reagent Solutions
Successful execution of comparative analytical studies requires specialized reagents and materials. The following table details key solutions and their applications in biosimilarity assessment:
Table 3: Essential Research Reagent Solutions for Biosimilarity Assessment
| Reagent/Material | Function/Application | Key Considerations |
|---|---|---|
| Reference Standards | Primary comparator for all analytical testing; defines acceptance criteria | Must be sourced from appropriate markets (US/EU); require ≥10 lots to capture variability [52] |
| Qualified In-House Standards | System suitability testing; assay control | Must be properly qualified against reference standards; monitored for drift [52] |
| Cell Lines for Expression | Biosimilar production; host cell protein analysis | Expression system must match reference sequence; impacts post-translational modifications [52] |
| Chromatography Resins | Purification and analysis of product-related impurities | Selection critical for removing host cell proteins, aggregates, and fragments |
| Mass Spectrometry Grade Solvents | Peptide mapping; PTM characterization | High purity essential for sensitive detection of sequence variants and modifications |
| Glycan Analysis Standards | Characterization of glycosylation profiles | Essential for assessing critical quality attributes affecting efficacy and immunogenicity |
| Cell-Based Assay Reagents | Functional activity assessment (ADCC, CDC) | Relevance to mechanism of action; assay precision and accuracy validation required |
| Forced Degradation Reagents | Comparative stability studies | Oxidative, thermal, pH stress conditions; demonstrates similar degradation profiles |
Case Study: Ustekinumab Biosimilars and Immunogenicity Assessment
A recent comprehensive review of all approved ustekinumab biosimilars demonstrates the critical role of comparative analytical assessment in evaluating immunogenicity [51]. The study revealed that single-dose clinical PK studies were sensitive in detecting anti-drug antibody (ADA) and neutralizing antibody (Nab) rates between biosimilars and the reference product [51]. Importantly, the comparative efficacy studies confirmed the findings from the single-dose PK studies, providing no additional information about immunogenicity comparability [51].
Analytically, lower immunogenicity rates in some biosimilars correlated with reduced levels of non-human glycans, specifically α-1,3 galactose and N-glycolylneuraminic acid, which have been shown to have potential immunogenic relevance [51]. This finding corroborates the predictive nature of the analytical assessment for comparable immunogenicity, a principle successfully applied in the regulation of process manufacturing changes of biologics for over three decades [51].
Comparative analytical studies represent the foundation for demonstrating biosimilarity, integrating advanced analytical techniques with rigorous statistical approaches. The evolving regulatory landscape, including recent FDA guidance, emphasizes that robust analytical similarity may reduce clinical data requirements through a totality-of-evidence approach [51] [52]. As protein engineering continues to advance, with AI-driven design and enhanced analytical capabilities, the sensitivity and predictive value of these studies will further increase, strengthening the scientific basis for biosimilar development and potentially streamlining regulatory pathways. This progress ultimately supports the broader goal of expanding patient access to safe, effective, and more affordable biologic therapies.
High-Throughput Screening and Functional Assays for Efficacy Validation
High-throughput screening (HTS) represents a cornerstone technology in modern drug discovery, serving as the primary engine for identifying potential therapeutic candidates from vast chemical and biological libraries [56]. Within the context of protein-based therapeutics engineering research, HTS and subsequent functional assays are indispensable for validating the efficacy of engineered proteins, including monoclonal antibodies, bispecifics, and antibody-drug conjugates [57] [2]. The evolution from traditional single-concentration HTS to quantitative HTS (qHTS), which generates full concentration-response curves for thousands of substances, has significantly improved the reliability and information content of screening data [56]. These methodologies enable researchers to rapidly prioritize lead candidates based on quantitative parameters such as potency and efficacy, thereby accelerating the development of next-generation biologics. This document provides detailed application notes and protocols for implementing robust HTS and functional assays, framed within the rigorous requirements of academic and industrial protein therapeutic development.
Key HTS Assay Platforms and Applications
Recent advances in HTS technologies have expanded the toolbox available for efficacy validation of protein-based therapeutics. The table below summarizes two contemporary assay platforms that exemplify the integration of high-throughput capability with robust biological relevance.
Table 1: Key High-Throughput Screening Assay Platforms
| Assay Platform | Biological Target/System | Key Readout | Therapeutic Application | Reference |
|---|---|---|---|---|
| Dual-Color Fluorescent Assay | Chikungunya Virus (CHIKV) in Vero cells | Infection inhibition & Cytotoxicity (via immunofluorescence) | Antiviral drug discovery [58] | [58] |
| Fluorescent Peptide-Based Assay | SIRT7 deacetylase activity | Fluorescent signal change from substrate peptides | Epigenetic target/Enzyme inhibitor screening [59] | [59] |
The dual-color fluorescent assay for Chikungunya virus represents a sophisticated approach for simultaneous efficacy and cytotoxicity assessment [58]. This assay utilizes Vero cells as the host line, infected with CHIKV at an optimized multiplicity of infection (MOI) of 0.1. Cells are stained with a CHIKV-specific polyclonal antibody and DAPI to distinguish infected cells from the total cell population automatically. This method allows for the concurrent calculation of percentage inhibition of viral infection and the percentage of total cells remaining, providing an integrated view of compound activity and cellular toxicity in a single workflow [58].
For targeted screening against specific proteins, fluorescent peptide-based assays offer a highly specific and scalable solution. The protocol for identifying SIRT7 inhibitors involves large-scale purification of recombinant His-SIRT7 proteins from E. coli, followed by enzymatic reactions with fluorescently labeled substrate peptides [59]. The core principle is the enzyme-dependent change in the fluorescent signal of these substrate polypeptides, enabling rapid measurement of SIRT7 activity in the presence or absence of candidate inhibitors in a microplate-based format. This approach is particularly valuable for screening engineered proteins designed to modulate enzymatic activity [59].
Detailed Experimental Protocol: Dual-Color Cell-Based Antiviral Assay
Background and Principle
This protocol details the steps for a cell-based high-throughput screening assay designed to identify and validate antiviral compounds, adaptable for testing therapeutic antibodies. It uses a dual-color immunofluorescence readout to quantify both viral inhibition and compound cytotoxicity simultaneously [58]. The assay is validated using reference controls, ensuring robust identification of active substances.
Materials and Reagents
Table 2: Research Reagent Solutions and Essential Materials
| Item | Function/Description |
|---|---|
| Vero Cells (ATCC CCL-81) | Host cell line for CHIKV infection; selected for interferon deficiency enabling high viral replication [58]. |
| CHIKV ECSA Strain | Challenge virus; represents a relevant pathogenic strain for antiviral discovery [58]. |
| Anti-CHIKV Polyclonal Antibody | Primary antibody for specific detection of infected cells via immunofluorescence [58]. |
| Fluorescently-Labeled Secondary Antibody | Enables visualization of bound primary antibody. |
| DAPI (4',6-diamidino-2-phenylindole) | Fluorescent nuclear stain used to quantify the total number of cells in a well [58]. |
| Cell Culture Plates (e.g., 96- or 384-well) | Vessels for cell culture and HTS experimentation. |
| Cycloheximide (CHX) | Reference positive control inhibitor of eukaryotic translation, providing 100% inhibition [58]. |
| Acyclovir (ACY) | Reference negative control (inactive against CHIKV) [58]. |
| Dimethyl Sulfoxide (DMSO) | Standard solvent for compound libraries. |
Step-by-Step Procedure
Host Cell Seeding:
- Seed Vero cells at an optimized density of 10,000 cells per well in a 96-well plate (or a proportionally scaled density for other plate formats). Culture the cells for 48 hours to achieve approximately 87% confluency, which ensures uniform infection while avoiding overconfluency that can compromise cell health [58].
Viral Infection and Compound Treatment:
- Infect the cells with CHIKV ECSA strain at an optimized MOI of 0.1. This MOI was selected based on its minimal cytopathic effect and excellent discrimination power (Z' factor > 0.5) between infected and uninfected control wells [58].
- Co-incubate the virus with the test compounds (e.g., candidate therapeutic antibodies or small molecules). Include control wells on every plate:
- Infected Control (CVD): Cells + Virus + DMSO.
- Non-infected Control (CD): Cells + DMSO only.
- Positive Control: Cells + Virus + Cycloheximide (CHX).
- Negative Control: Cells + Virus + Acyclovir (ACY).
- Incubate the plate for 24 hours to allow for viral replication and compound action.
Dual-Color Immunofluorescence Staining:
- After incubation, fix the cells with an appropriate fixative (e.g., 4% paraformaldehyde).
- Permeabilize the cells using a detergent like Triton X-100.
- Stain the cells using a primary anti-CHIKV polyclonal antibody.
- Subsequently, stain with a fluorescently-labeled secondary antibody to detect CHIKV-infected cells.
- Counterstain the nuclei with DAPI to identify all cells present.
Image Acquisition and Analysis:
- Image each well using a high-content imager or automated fluorescence microscope.
- Analyze the images using a dedicated image analysis algorithm to quantify the number of infected cells (fluorescent signal from the secondary antibody) and the total number of cells (DAPI signal) in each well [58].
Data Calculation and Hit Identification:
- Calculate the % Inhibition for each test well:
% Inhibition = [1 - (Test_Infected - CD_Infected) / (CVD_Infected - CD_Infected)] * 100where "Infected" refers to the count of CHIKV-positive cells. - Calculate the % Cells Left for each test well as a proxy for viability:
% Cells Left = (Test_Total / CD_Total) * 100where "Total" refers to the count of DAPI-positive nuclei. - A compound is typically considered a "hit" for efficacy if it shows inhibition exceeding a predefined cutoff (e.g., 80% inhibition) while maintaining an acceptable level of cell viability (e.g., >80% cells left) [58].
- Calculate the % Inhibition for each test well:
<75 chars>Dual-Color Antiviral Screening Assay Workflow*
Data Analysis and Validation in qHTS
Concentration-Response Modeling and the Hill Equation
In quantitative HTS (qHTS), where substances are tested across a range of concentrations, the Hill equation (HEQN) is the standard model for analyzing concentration-response relationships [56]. The logistic form of the equation is:
( Ri = E0 + \frac{(E{\infty} - E0)}{1 + \exp{-h[\log Ci - \log AC{50}]}} )
Where:
- ( Ri ) is the measured response at concentration ( Ci ).
- ( E_0 ) is the baseline response.
- ( E_{\infty} ) is the maximal response.
- ( AC_{50} ) is the concentration producing half-maximal response (potency).
- ( h ) is the Hill slope (shape parameter) [56].
The parameters ( AC{50} ) and ( E{max} ) (calculated as ( E{\infty} - E0 )) are critical for ranking compounds by potency and efficacy, respectively. However, the reliability of these parameter estimates is highly dependent on the assay design and data quality [56].
Statistical Validation and Quality Control
Robust validation is required to ensure that hit identification is reliable. The Z' factor is a key metric for assessing the quality and suitability of an HTS assay:
( Z' = 1 - \frac{3(\sigma{p} + \sigma{n})}{|\mu{p} - \mu{n}|} )
Where ( \sigma{p} ) and ( \sigma{n} ) are the standard deviations of positive (p) and negative (n) controls, and ( \mu{p} ) and ( \mu{n} ) are their respective means. A Z' factor > 0.5 indicates an excellent assay with a strong separation between controls, which is essential for a successful HTS campaign [58].
The reproducibility of the assay must be confirmed across independent experimental rounds. Statistical analysis (e.g., ANOVA) of the inhibition and viability values from positive and negative controls across multiple rounds should show no significant variation [58].
Table 3: Impact of Assay Conditions and Replicates on Parameter Estimation
| True AC₅₀ (μM) | True Eₘₐₓ (%) | Number of Replicates (n) | Mean and [95% CI] for AC₅₀ Estimates | Mean and [95% CI] for Eₘₐₓ Estimates |
|---|---|---|---|---|
| 0.001 | 50 | 1 | 6.18e-05 [4.69e-10, 8.14] | 50.21 [45.77, 54.74] |
| 0.001 | 50 | 3 | 1.74e-04 [5.59e-08, 0.54] | 50.03 [44.90, 55.17] |
| 0.001 | 50 | 5 | 2.91e-04 [5.84e-07, 0.15] | 50.05 [47.54, 52.57] |
| 0.1 | 25 | 1 | 0.09 [1.82e-05, 418.28] | 97.14 [-157.31, 223.48] |
| 0.1 | 25 | 3 | 0.10 [0.03, 0.39] | 25.53 [5.71, 45.25] |
| 0.1 | 25 | 5 | 0.10 [0.05, 0.20] | 24.78 [-4.71, 54.26] |
Data adapted from simulation studies on qHTS parameter estimation [56].
As illustrated in Table 3, parameter estimates from the Hill equation, particularly the AC₅₀, can be highly variable and imprecise when the tested concentration range fails to define the asymptotes of the curve (e.g., when AC₅₀ is at the edge of the concentration range) or when the signal-to-noise ratio is low (low Eₘₐₓ) [56]. Including experimental replicates (n=3 to 5) significantly improves the precision of parameter estimates, leading to narrower confidence intervals and more reliable potency rankings for lead optimization [56].
Concluding Remarks
The integration of robust, high-throughput screening with rigorous functional assays is a critical driver in the accelerating field of protein-based therapeutics [2]. The protocols and analyses detailed herein provide a framework for the efficacy validation of engineered proteins, from initial screening against viral targets or enzymes to quantitative concentration-response modeling. Key to success is the implementation of well-optimized and statistically validated assays, such as the dual-color fluorescent assay, which minimizes false positives and negatives by concurrently evaluating efficacy and cytotoxicity [58]. Furthermore, a clear understanding of the limitations of nonlinear modeling in qHTS, and the adoption of practices that improve parameter estimation—such as optimal concentration range selection and replication—are essential for generating high-quality, reproducible data [56]. As protein engineering continues to produce increasingly sophisticated biologics, these HTS and validation methodologies will remain fundamental to translating innovative designs into effective clinical therapies.
Immunogenicity, the unwanted immune response provoked by protein-based therapeutics, remains a significant challenge in biopharmaceutical development [60]. These adverse immune reactions can lead to the production of anti-drug antibodies (ADAs), which may neutralize drug efficacy, alter pharmacokinetic profiles, and in some cases, cause severe safety events including hypersensitivity reactions and life-threatening conditions [61] [62]. The clinical consequences span from diminished therapeutic effect to complete treatment failure, presenting substantial risks for both patients and drug development programs [61]. Within the broader context of protein-based therapeutics engineering research, comprehensive immunogenicity assessment provides the critical foundation for developing safer, more effective biologics through systematic risk prediction and mitigation strategies.
The immune mechanisms underlying immunogenicity primarily involve T-cell dependent pathways, where antigen-presenting cells internalize biotherapeutics, process them into peptides, and present them via major histocompatibility complex (MHC) molecules to T-cells, ultimately triggering B-cell activation and ADA production [61]. Less commonly, T-cell independent pathways may be activated through direct B-cell receptor cross-linking by biotherapeutics with repetitive epitope structures [61]. Understanding these fundamental mechanisms is essential for designing effective assessment and mitigation strategies.
Immunogenicity Risk Factors and Categorization
Immunogenicity risk is influenced by a complex interplay of factors that must be systematically evaluated during drug development. The European Immunogenicity Platform (EIP) categorizes these factors into product-, process-, patient-, and treatment-related risks [61].
Product-Related Risk Factors
Product-related factors constitute the fundamental immunogenicity drivers rooted in the biotherapeutic's inherent characteristics:
Sequence Origin: Non-self sequences, particularly in complementarity determining regions (CDRs) of monoclonal antibodies, represent major immunogenicity determinants [61]. Even fully human or humanized biotherapeutics can exhibit unexpected immunogenicity profiles, as demonstrated by bococizumab, a humanized mAb targeting PCSK9 that induced high-titer ADAs impacting long-term efficacy [61].
Post-Translational Modifications: Engineering modifications, such as those in the CH2 domain to modulate effector functions or linkers in fusion proteins, can introduce novel T-cell epitopes [61] [62].
Mechanism of Action and Target Expression: The biological context of drug-target interaction significantly influences immunogenicity potential, particularly for drugs targeting immune pathways [63].
Clinical and Treatment-Related Risk Factors
Recent research has identified key clinical factors that significantly impact immunogenicity risk:
Table 1: Clinical Factors Affecting Immunogenicity Risk
| Factor Category | Risk Influence | Clinical Impact |
|---|---|---|
| Route of Administration | Subcutaneous > Intramuscular > Intravenous | Influences immune recognition and processing |
| Concomitant Medications | Immunosuppressants reduce risk | Can mask or modify immunogenicity |
| Disease Status | Inflammatory > Non-inflammatory | Underlying immune activation increases risk |
| Treatment Duration | Chronic > Acute | Repeated exposure increases sensitization chance |
| Patient Population | Genetic variations (e.g., HLA haplotypes) | Population-specific differences in immune response |
Research from Roche/Genentech demonstrates that integrating these clinical factors with in silico T-cell epitope prediction significantly improves immunogenicity risk prediction accuracy (AUC improved from 0.72 to 0.93) [63].
Risk Level Assignment Framework
The EIP recommends a structured approach for assigning overall immunogenicity risk levels prior to clinical development:
- Low Risk: Minimal impact on safety/efficacy if ADAs develop; minimal business risk
- Medium Risk: Potential for meaningful impact on safety/efficacy; moderate business risk
- High Risk: Potential for severe safety consequences and/or substantial efficacy loss; significant business risk [61]
This risk categorization directly informs the extent of required mitigation strategies and bioanalytical monitoring approaches throughout drug development.
Immunogenicity Assessment Methodologies
Comprehensive immunogenicity assessment requires a multi-tiered experimental approach employing complementary technologies to characterize both humoral and cellular immune responses.
Humoral Immunogenicity Assessment
Humoral immunogenicity assessment focuses on detecting and characterizing ADAs through validated immunoassays:
- Ligand Binding Assays (LBA): Platform comparisons for soluble mediator detection
- Neutralizing Antibody (NAb) Assays: Assess ADA impact on biological function
Table 2: Analytical Platforms for Immunogenicity Assessment
| Platform | Detection Principle | Applications | Sensitivity | Multiplexing Capacity |
|---|---|---|---|---|
| MSD ECL | Electrochemiluminescence | Cytokine profiling, ADA screening | High (pg/mL) | Medium (up to 10-plex) |
| Luminex | Fluorescent-coded beads | Multiplex cytokine analysis | High | High (up to 50-plex) |
| Ella | Automated microfluidic immunoassay | Rapid cytokine quantification | Medium-High | Low (single-plex) |
| ELISA | Enzyme-linked colorimetric detection | Standard ADA screening | Medium | Low |
| Flow Cytometry | Cell-surface and intracellular staining | Cellular immunophenotyping | Limited by event acquisition | High (15+ parameters) |
| ELISpot | Membrane-bound cytokine capture | Frequency of antigen-reactive cells | Very high | Low |
Technology selection depends on multiple factors including required sensitivity, sample volume availability, multiplexing needs, and specific research questions [60]. For antigens with expected low immunogenicity, such as in chronic diseases, ELISpot offers superior sensitivity for detecting rare antigen-reactive cells, while flow cytometry provides comprehensive cellular immunophenotyping capability [60].
Cellular Immunogenicity Assessment
Cellular immunogenicity is particularly relevant for advanced modalities like CAR-T cell therapies, where MHC class-I-mediated CD8+ cytotoxic T-cell responses can develop against CAR constructs in addition to antibody responses [64]. Assessment challenges include cell survival issues, assay variability, lack of relevant positive controls, and reagent limitations [64].
Key methodologies for cellular immunogenicity assessment:
- ELISpot: High-sensitivity detection of antigen-reactive T-cells through cytokine secretion
- Multiparametric Flow Cytometry: Comprehensive immunophenotyping of antigen-reactive cells, including differentiation status (naïve, effector memory, central memory) and activation markers (CD137, CD154, CD25, CD69) [60]
- Intracellular Cytokine Staining: Functional profiling of antigen-reactive T-cells (IFN-γ, TNF-α, IL-2, IL-4, IL-17A)
- Cytotoxic Marker Analysis: Assessment of lytic potential (Granzyme B, perforin, CD107a/b) [60]
Experimental Protocols
T-Cell Dependent Immunogenicity Risk Assessment Protocol
This protocol evaluates the potential for T-cell dependent immunogenicity through in silico and in vitro approaches [61] [63].
Materials and Reagents:
- Purified biotherapeutic protein (>95% purity)
- Human PBMCs from at least 50 healthy donors
- RPMI-1640 complete medium with L-glutamine
- Human AB serum (heat-inactivated)
- T-cell activation markers (anti-CD154, anti-CD137, anti-CD69)
- MHC class II tetramers (custom-conjugated)
- Intracellular cytokine staining antibodies
- ELISpot plates (IFN-γ, IL-2 capture)
- Antigen-presenting cell line (e.g., monocyte-derived dendritic cells)
Procedure:
- T-cell Epitope Mapping:
- Perform in silico prediction of potential T-cell epitopes using IEDB and CEDAR tools
- Synthesize 15-mer peptides overlapping by 11 amino acids covering entire protein sequence
PBMC Stimulation:
- Isclude PBMCs from healthy donors using Ficoll density gradient centrifugation
- Plate 2×10^5 PBMCs/well in 96-well U-bottom plates
- Stimulate with individual peptides (10 µg/mL) or full protein (50 µg/mL)
- Include positive controls (anti-CD3/CD28) and negative controls (DMSO vehicle)
- Culture for 7-9 days at 37°C, 5% CO2
T-cell Activation Analysis:
- Harvest cells and stain for surface markers (CD3, CD4, CD8, CD154, CD137)
- Fix, permeabilize, and stain for intracellular cytokines (IFN-γ, IL-2, TNF-α)
- Acquire data using flow cytometry (minimum 100,000 events per sample)
- Analyze frequency of antigen-reactive T-cells and cytokine profiles
MHC Restriction Analysis:
- Generate MHC class II tetramers for predicted immunodominant epitopes
- Stain activated T-cells to confirm MHC restriction
- Perform blocking experiments with anti-MHC class II antibodies
Data Analysis: Calculate stimulation index (SI) for each donor and peptide: SI = (response to peptide)/(response to negative control). Peptides with SI >2 in >10% of donors are considered immunogenic. Integrate clinical factors including mechanism of action, route of administration, and patient population characteristics to refine risk prediction [63].
Cross-Assay Calibration Protocol for Immunogenicity Biomarkers
This protocol addresses the challenge of comparing immunogenicity data generated across different laboratories and assay platforms, particularly relevant for collaborative studies and meta-analyses [65].
Materials and Reagents:
- Reference standard (WHO international standard, if available)
- Quality control samples (high, medium, low response levels)
- Paired samples for bridging (minimum n=30)
- Assay-specific reagents and buffers
- Statistical software (R, SAS, or equivalent)
Procedure:
- Sample Preparation:
- Aliquot sufficient volume of paired samples for both assays
- Ensure sample integrity through consistent handling and storage
- Include samples spanning the dynamic range of both assays
Parallel Testing:
- Test all paired samples in both assays within the same time frame
- Incorporate standards and quality controls in each run
- Document any values below the limit of detection (LOD)
Data Collection:
- Record raw values for all samples
- Note any technical issues or outliers
- Document assay performance characteristics
Statistical Analysis:
- Left-Censored Multivariate Normal Modeling:
- Account for values below LOD using statistical imputation
- Model the relationship between assays accounting for measurement error
- Assume common assay differences across settings
- Calibration Model Development:
- Establish mathematical relationship between assay measurements
- Generate conversion factors with confidence intervals
- Validate model using hold-out samples
Implementation: Apply calibration model to convert values from one assay to another's scale, enabling cross-assay data comparison and meta-analysis. This approach is particularly valuable for combining immunogenicity data from multiple studies using different analytical platforms [65].
Research Reagent Solutions
Table 3: Essential Research Reagents for Immunogenicity Assessment
| Reagent Category | Specific Examples | Primary Function | Application Context |
|---|---|---|---|
| T-cell Activation Markers | Anti-CD154, anti-CD137, anti-CD25, anti-CD69 | Identification of antigen-reactive T-cells | Flow cytometry-based cellular immunogenicity |
| Cytokine Detection Antibodies | IFN-γ, IL-2, IL-4, IL-17A capture/detection | Functional characterization of T-cell responses | ELISpot, intracellular cytokine staining |
| MHC Reagents | MHC class I/II tetramers, anti-MHC antibodies | T-cell specificity and restriction analysis | Epitope mapping, immunodominance |
| Cell Separation Kits | PBMC isolation kits, CD4+/CD8+ T-cell kits | Sample preparation for functional assays | All cellular immunogenicity assays |
| Aptamer Libraries | Factor VIII-specific aptamers | Conformational epitope mapping | Protein structure-immunogenicity relationship |
| Cytotoxicity Reagents | Anti-Granzyme B, anti-perforin, CD107a/b | Assessment of cytotoxic potential | Cellular immunogenicity for novel modalities |
Immunogenicity Risk Mitigation Strategies
Effective immunogenicity risk management requires tailored strategies throughout the product development lifecycle, from candidate selection to post-marketing surveillance.
Preclinical Mitigation Approaches
- De-immunization: Redesign biotherapeutics to remove T-cell epitopes identified through in silico prediction and in vitro validation [61] [62]
- Aptamer-Based Conformational Analysis: Utilize nucleic acid aptamers to probe protein therapeutics for conformational changes that may increase immunogenicity potential [62]
- Personalized Protein Engineering: Develop protein variants matched to patient haplotypes and HLA types, particularly relevant for therapeutics like Factor VIII where population-specific differences in immunogenicity are observed [62]
Clinical Mitigation Strategies
- Immunosuppressive Regimens: Implement concomitant immunosuppression based on identified risk level, particularly for high-risk modalities [66]
- Route Optimization: Select administration routes associated with lower immunogenicity risk when clinically appropriate [63]
- Patient Stratification: Identify high-risk patients through HLA typing and previous immunogenicity history [66] [62]
- Dose Regimen Optimization: Adjust dosing frequency and amounts to balance efficacy with immunogenicity risk [61]
Workflow and Pathway Visualizations
Immunogenicity Risk Assessment Workflow
T-Cell Dependent Immunogenicity Pathway
Cellular Immunogenicity Assessment Workflow
Immunogenicity assessment represents a critical component of protein-based therapeutic engineering, requiring integrated approaches that span in silico prediction, in vitro characterization, and clinical evaluation. The framework presented enables systematic risk identification, assessment, and mitigation throughout the product development lifecycle. As biotherapeutic modalities continue to evolve, particularly with advanced cell and gene therapies, immunogenicity assessment strategies must similarly advance to address novel challenges such as cellular immune responses against CAR constructs and residuals from manufacturing processes [64]. The integration of clinical factors with computational prediction represents a promising direction for improving immunogenicity risk assessment accuracy and developing safer, more effective biotherapeutics.
Application Note: AI-Driven Validation in Protein Therapeutics
The integration of artificial intelligence (AI) and machine learning (ML) is fundamentally transforming the validation processes within protein-based therapeutics research. This paradigm shift is moving from traditional, often manual, laboratory techniques to integrated computational workflows that augment and accelerate established practices. AI has ceased to be a mere 'add-on' and is now an essential component, providing the speed, scale, and insights necessary to engineer novel therapeutic proteins with specific functions and to predict how potential drug molecules will behave with unprecedented accuracy [67]. This application note details the protocols and key solutions for leveraging these technologies to validate protein designs, predict molecular properties, and streamline the transition from computational prediction to experimental verification.
Quantitative Impact of AI Integration
The adoption of AI and ML in biopharmaceutical research is yielding significant, measurable improvements in efficiency and success rates. The data below summarizes key quantitative impacts across the discovery and development pipeline.
Table 1: Measured Impact of AI/ML Integration in Biopharmaceutical Research
| Metric | Traditional Workflow | AI/ML-Enhanced Workflow | Data Source |
|---|---|---|---|
| Drug Discovery Timeline | ~5 years | 12-18 months [68] | Industry Analysis |
| Drug Discovery Cost | Baseline | Up to 40% reduction [68] | Industry Analysis |
| Experiment Planning Cycles | Baseline | 35% reduction [69] | Industry Case Study |
| Probability of Clinical Success | ~10% | Significantly increased [68] | Industry Analysis |
| Molecules in Discovery Pipeline | Baseline | >90% AI-assisted [67] | Leading Pharma Company |
Detailed Experimental Protocols
Protocol 1: AI-Assisted Protein Design and Validation Using Inverse Folding
This protocol utilizes an AI framework for inverse protein folding, a critical process for designing protein-based drugs with specific 3D structures [67].
1. Objective: To design a novel protein sequence that will fold into a predetermined tertiary structure, enabling the creation of therapeutics with tailored functions.
2. Materials & Computational Tools:
- MapDiff Framework: An innovative AI model for inverse protein folding that predicts the optimal amino acid sequence for a target backbone structure [67].
- Target Protein Structure: A resolved 3D structure (e.g., from PDB, AlphaFold, or RFdiffusion) serving as the design blueprint [67] [2].
- High-Performance Computing (HPC) Cluster: Cloud or local infrastructure to run computationally intensive AI models.
3. Procedure:
- Step 1: Input Target Structure. Feed the well-defined 3D protein backbone structure into the MapDiff framework.
- Step 2: Sequence Generation. Execute the MapDiff model to generate a probability distribution over amino acid sequences that are compatible with the input structure. The model acts as a guide, predicting the most important folds and their corresponding sequences [67].
- Step 3: In-silico Validation. Screen the top-generated sequences using molecular dynamics (MD) simulations to assess folding stability and conformational dynamics under physiological conditions.
- Step 4: Experimental Expression. Clone the validated sequences into an appropriate expression vector (e.g., in E. coli or mammalian cells) for protein production.
- Step 5: Structural Validation. Purify the expressed protein and validate its structure using techniques such as X-ray crystallography or cryo-electron microscopy (cryo-EM) to confirm it matches the intended target [27].
Protocol 2: Molecular Property Prediction with a Graph Attention Approach
This protocol uses a graph-based AI model to predict key molecular properties of a potential therapeutic protein, which is essential for understanding drug efficacy and safety profiles early in the development process [67].
1. Objective: To accurately predict the physicochemical and bioactivity properties of a designed protein therapeutic using its structural representation.
2. Materials & Computational Tools:
- Edge Set Attention (ESA) Model: A graph attention network specifically designed for molecular property prediction [67].
- Molecular Graph Representation: A computational graph where atoms are represented as nodes and chemical bonds are represented as edges [67].
3. Procedure:
- Step 1: Graph Construction. Convert the 3D structure of the candidate protein or biologic into its graph representation. Each atom becomes a node, and each bond becomes an edge, with features encoding atom type, charge, and bond order.
- Step 2: Model Inference. Process the molecular graph through the pre-trained ESA model. The model's attention mechanism learns to weight the importance of different bonds (edges) and atoms (nodes) for the specific property being predicted [67].
- Step 3: Property Prediction. Generate predictions for key properties such as binding affinity, solubility, and metabolic stability.
- Step 4: Experimental Correlation. Synthesize or express the top-predicted candidates and validate the forecasted properties using in vitro assays (e.g., Surface Plasmon Resonance for affinity, HPLC for solubility).
Protocol 3: Generative AI for Automated Analysis and Report Generation
This protocol integrates Generative AI to bridge the gap between raw ML outputs (e.g., protein folding predictions) and actionable, experiment-ready insights, dramatically accelerating research cycles [69].
1. Objective: To automatically generate plain-language, structured reports from complex ML model outputs to facilitate interdisciplinary collaboration and experimental planning.
2. Materials & Computational Tools:
- AWS Bedrock: A managed service providing access to foundation models like ProtGPT2 and ProtBERT, fine-tuned on proprietary protein data [69].
- AlphaFold on Amazon SageMaker: A deployed ML service for predicting protein folding and interaction structures [69].
- OpenWebUI Interface: A custom front-end for researchers to submit queries and retrieve results [69].
3. Procedure:
- Step 1: Data Ingestion & Prediction. Ingest raw protein sequence data into Amazon S3. Execute AlphaFold simulations on Amazon SageMaker to generate 3D structural models and confidence metrics [69].
- Step 2: Generative AI Summarization. Orchestrate via AWS Bedrock to pass the structural predictions and associated data to a fine-tuned LLM. The LLM is prompted to generate a summary contextualizing the folding predictions, highlighting unique structural features, and identifying potential therapeutic implications [69].
- Step 3: Human-in-the-Loop Validation. A scientist reviews the GenAI-generated report, validating, refining, or discarding the suggestions. Selected candidates undergo a secondary lethality re-check using additional ML models [69].
- Step 4: Experimental Briefing. The final, validated output is formatted into a structured experimental brief for wet-lab validation teams.
Workflow Visualization
The following diagram illustrates the integrated human-in-the-loop workflow for AI-driven protein design and validation, as described in the protocols.
AI-Driven Protein Validation Workflow
The Scientist's Toolkit: Research Reagent Solutions
Successful implementation of AI-driven validation requires a suite of specific computational and experimental tools.
Table 2: Essential Research Reagents and Tools for AI-Driven Protein Engineering
| Tool / Reagent | Type | Primary Function in Validation |
|---|---|---|
| MapDiff | AI Model | An inverse folding framework for designing protein sequences that fold into specific 3D structures [67]. |
| Edge Set Attention (ESA) | AI Model | A graph-based network for predicting molecular properties (e.g., binding affinity, solubility) from structural data [67]. |
| AlphaFold | AI Model | Predicts 3D protein structures from amino acid sequences with high accuracy, serving as a ground truth for design or validation [69]. |
| AWS Bedrock | Platform | Provides managed access to foundational models (e.g., ProtGPT2) for generating summaries and insights from ML outputs [69]. |
| Amazon SageMaker | Platform | A cloud-based service for deploying, training, and running ML models like AlphaFold at scale [69]. |
| Cryo-EM / X-ray Crystallography | Analytical Instrument | Used for experimental validation of AI-predicted protein structures, providing high-resolution structural confirmation [27]. |
Conclusion
The field of protein-based therapeutics engineering is at a pivotal juncture, driven by synergies between advanced computational models, high-throughput experimental methods, and deep structural biology insights. Key takeaways include the critical need to balance gains in stability and pharmacokinetics with preserved biological activity, the expanding repertoire of protein scaffolds beyond traditional antibodies, and the growing importance of robust validation frameworks for biosimilars and novel entities. Future progress will hinge on overcoming persistent challenges, such as targeting intrinsically disordered protein regions and accurately predicting immunogenicity. The continued integration of AI and machine learning promises to accelerate the de novo design of next-generation therapeutics, ultimately unlocking new treatment paradigms for cancer, autoimmune diseases, and other complex conditions.
References
- 1. Engineering protein-based therapeutics through structural ... [https://www.nature.com/articles/s41467-023-38039-x]
- 2. Protein engineering as a driver of innovation in ... [https://link.springer.com/article/10.1007/s44371-025-00313-w]
- 3. Protein-based Therapeutics Strategic Insights: Analysis ... [https://www.archivemarketresearch.com/reports/protein-based-therapeutics-337469]
- 4. Protein Engineering Market Competitive Landscape Report ... [https://finance.yahoo.com/news/protein-engineering-market-competitive-landscape-115200693.html]
- 5. Protein Engineering and Drug Discovery [https://www.mdpi.com/2218-273X/15/11/1628]
- 6. Beyond evolution: De novo designed protein toolkit ... [https://www.sciencedirect.com/science/article/pii/S2590053625001314]
- 7. Protocols for Rational Design of Protein Solubility and ... [https://www.lifescience.net/publications/1567880/protocols-for-rational-design-of-protein-solubilit/]
- 8. A structure-based tool to interpret the significance of kinase ... [https://pmc.ncbi.nlm.nih.gov/articles/PMC12358288/]
- 9. Rational engineering of allosteric protein switches by in ... [https://www.nature.com/articles/s41592-025-02741-z]
- 10. Structure-guided engineering of type I-F CASTs for ... [https://www.nature.com/articles/s41467-025-63164-0]
- 11. Directed evolution [https://en.wikipedia.org/wiki/Directed_evolution]
- 12. A Technical Guide to Directed Evolution for Enhancing ... [https://www.ranomics.com/a-technical-guide-to-directed-evolution-for-enhancing-protein-stability-and-function]
- 13. A primer to directed evolution: current methodologies and ... [https://pmc.ncbi.nlm.nih.gov/articles/PMC10074555/]
- 14. High Throughput Screening and Selection Methods for ... [https://pmc.ncbi.nlm.nih.gov/articles/PMC4461044/]
- 15. Ultrahigh-throughput screening-assisted in vivo directed ... [https://biotechnologyforbiofuels.biomedcentral.com/articles/10.1186/s13068-024-02457-w]
- 16. The Role of AI-Driven De Novo Protein Design in the ... [https://pmc.ncbi.nlm.nih.gov/articles/PMC12467925/]
- 17. Recent advances in de novo protein design [https://pmc.ncbi.nlm.nih.gov/articles/PMC8065224/]
- 18. Creating Life's Building Blocks: Models for De Novo Protein ... [https://frontlinegenomics.com/creating-lifes-building-blocks-models-for-de-novo-protein-design/]
- 19. De novo design of protein structure and function with ... [https://www.nature.com/articles/s41586-023-06415-8]
- 20. Machine learning-aided design and screening of an ... [https://www.nature.com/articles/s41467-024-46203-0]
- 21. Technological advancements in antibody-based therapeutics ... [https://jbiomedsci.biomedcentral.com/articles/10.1186/s12929-025-01190-2]
- 22. Engineered receptors for soluble cellular ... [https://www.nature.com/articles/s41586-024-08366-0]
- 23. Engineered Receptors Enable Soluble Ligand Detection ... [https://www.marinbio.com/engineered-receptors-enable-soluble-ligand-detection-and-programmable-cellular-therapies/]
- 24. The Future of Protein Drugs in 2025: Breakthroughs, ... [https://blog.bccresearch.com/the-future-of-protein-drugs-in-2025-breakthroughs-challenges-and-whats-next]
- 25. Antibodies to watch in 2025 [https://pubmed.ncbi.nlm.nih.gov/39711140/]
- 26. Transformative protein scaffold designs for dual-modality ... [https://www.sciencedirect.com/science/article/abs/pii/S0141813025054339]
- 27. Protein Engineering Paving the Way for Next-Generation ... [https://www.mdpi.com/2673-8937/5/3/28]
- 28. Revolutionizing therapeutic protein design with synthetic ... [https://www.news-medical.net/news/20250808/Revolutionizing-therapeutic-protein-design-with-synthetic-biology.aspx]
- 29. Prevent Protein Aggregation in Formulations: A Guide [https://www.leukocare.com/blog/how-to-prevent-protein-aggregation-in-formulations]
- 30. Stabilization challenges and aggregation in protein-based ... [https://pmc.ncbi.nlm.nih.gov/articles/PMC10711991/]
- 31. Exploring Protein Aggregation in Biological Products [https://link.springer.com/article/10.1208/s12249-025-03189-2]
- 32. The chemical chaperone 4-phenylbutyric acid rescues ... [https://www.nature.com/articles/s41420-025-02476-y]
- 33. Navigating the landscape of protein folding and proteostasis [https://www.nature.com/articles/s41392-025-02439-w]
- 34. redefining chaperone biology and therapeutic strategies in ... [https://pubs.rsc.org/en/content/articlehtml/2025/cb/d5cb00010f]
- 35. Glycosylation of Therapeutic Proteins: An Effective Strategy ... [https://pmc.ncbi.nlm.nih.gov/articles/PMC2805475/]
- 36. Site-Specific PEGylation of Therapeutic Proteins - PMC [https://pmc.ncbi.nlm.nih.gov/articles/PMC4632829/]
- 37. Research progress on the PEGylation of therapeutic ... [https://www.frontiersin.org/journals/pharmacology/articles/10.3389/fphar.2024.1353626/full]
- 38. PEGylation of Proteins: A Structural Approach [https://www.biopharminternational.com/view/pegylation-proteins-structural-approach]
- 39. Site-directed Mutagenesis Methods | IDT [https://www.idtdna.com/page/support-and-education/decoded-plus/methods-for-site-directed-mutagenesis/]
- 40. An efficient one-step site-directed deletion, insertion, single ... [https://pmc.ncbi.nlm.nih.gov/articles/PMC2629768/]
- 41. Strategies for Glycoengineering Therapeutic Proteins [https://www.frontiersin.org/journals/chemistry/articles/10.3389/fchem.2022.863118/full]
- 42. Engineering FcRn binding kinetics dramatically extends ... [https://jbioleng.biomedcentral.com/articles/10.1186/s13036-025-00506-y]
- 43. Fc engineering and the antibody immune code [https://www.news-medical.net/whitepaper/20251024/Fc-engineering-and-the-antibody-immune-code.aspx]
- 44. Pharmacokinetics of Recombinant Bifunctional Fusion Proteins [https://pmc.ncbi.nlm.nih.gov/articles/PMC3718553/]
- 45. Half‐life extension of single‐domain antibody–drug ... [https://pmc.ncbi.nlm.nih.gov/articles/PMC11082534/]
- 46. Single-chain variable fragments targeting domain II of ... [https://pubmed.ncbi.nlm.nih.gov/40825435/]
- 47. Emerging Strategies for Developing Next-Generation ... [https://pmc.ncbi.nlm.nih.gov/articles/PMC6238641/]
- 48. Optimizing Cancer Treatment: A Comprehensive Review of ... [https://pmc.ncbi.nlm.nih.gov/articles/PMC12584355/]
- 49. Smart Targeting To Improve Cancer Therapeutics | DDDT [https://www.dovepress.com/smart-targeting-to-improve-cancer-therapeutics-peer-reviewed-fulltext-article-DDDT]
- 50. Recent Tumor Necrosis Factor-Related Apoptosis-Inducing Ligand... [https://pmc.ncbi.nlm.nih.gov/articles/PMC11922527/]
- 51. Analytical Data and Single-Dose PK are Sufficient to ... - PMC [https://pmc.ncbi.nlm.nih.gov/articles/PMC12354544/]
- 52. FDA Guidance on Biosimilars: Key Analytical Factors and ... [https://www.linkedin.com/posts/ravi-krovidi-9a16a647_fda-guidance-sept-2025-biosimilars-key-activity-7374312960736886785-tN-I]
- 53. Industry Information and Guidance [https://www.fda.gov/drugs/biosimilars/industry-information-and-guidance]
- 54. Comparison of Innovative and Conventional Methods in ... [https://pmc.ncbi.nlm.nih.gov/articles/PMC11630730/]
- 55. The Different Colors of mAbs in Solution - PMC [https://pmc.ncbi.nlm.nih.gov/articles/PMC8161444/]
- 56. Quantitative high-throughput screening data analysis [https://pmc.ncbi.nlm.nih.gov/articles/PMC4375054/]
- 57. Antibody Engineering and Therapeutics 2025 [https://www.seromyx.com/antibody-engineering-and-therapeutics-2025]
- 58. Development, validation, and application of a dual-color ... [https://www.nature.com/articles/s41598-025-16087-1]
- 59. Protocol for high-throughput screening of SIRT7 inhibitors ... [https://www.sciencedirect.com/science/article/pii/S2666166725001261]
- 60. Comparing Immunogenicity Assessment Techniques [https://kcasbio.com/blogs/immunogenicity-a-comparative-analysis-of-assessment-methods/]
- 61. Immunogenicity risk assessment for tailored mitigation and ... [https://www.frontiersin.org/journals/immunology/articles/10.3389/fimmu.2025.1581153/full]
- 62. Immunogenicity of Protein-based Therapeutics [https://www.fda.gov/vaccines-blood-biologics/science-research-biologics/immunogenicity-protein-based-therapeutics]
- 63. Evaluating the Immunogenicity Risk of Protein ... [https://pubmed.ncbi.nlm.nih.gov/39849284/]
- 64. Cellular Immunogenicity Assessments in CAR-T Cell ... [https://pubmed.ncbi.nlm.nih.gov/40908464/]
- 65. Comparing and combining data from immune assays ... [https://pmc.ncbi.nlm.nih.gov/articles/PMC9790822/]
- 66. Strategies for improving the management of immune- ... [https://pmc.ncbi.nlm.nih.gov/articles/PMC7735083/]
- 67. AI Drug Discovery: MapDiff & Edge Set Attention ... [https://www.astrazeneca.com/content/astraz/what-science-can-do/topics/data-science-ai/mapdiff-edge-set-attention-ai-protein-design-breakthroughs.html]
- 68. AI in Pharma and Biotech: Market Trends 2025 and Beyond [https://www.coherentsolutions.com/insights/artificial-intelligence-in-pharmaceuticals-and-biotechnology-current-trends-and-innovations]
- 69. Integrating Machine Learning and Generative AI for Protein ... [https://ptp.cloud/ml-genai-protein-research-biotech/]